facetting a facetted facet ggplot
In this post, I use patchwork to nest three levels of facetted ggplots.
The plots shown below are:
- The diamonds data set: price vs carat
- The diamonds data set: price vs carat - facetted by
cut. - The diamonds data set: price vs carat - facetted by
cut, then facetted within eachcutbycolor - The diamonds data set: price vs carat - facetted by
cut, then facetted within eachcutbycolor, then each of those facets are factted byclarity.
core plot function
#~~~~~~~~~~~~~~~~~~~~~~~~~~~~~~~~~~~~~~~~~~~~~~~~~~~~~~~~~~~~~~~~~~~~~~~~~~~~~
# This is the core plot that will be used at different facetting levels
#~~~~~~~~~~~~~~~~~~~~~~~~~~~~~~~~~~~~~~~~~~~~~~~~~~~~~~~~~~~~~~~~~~~~~~~~~~~~~
create_plot <- function(.data, title = "Diamonds", theme_size = 12) {
  ggplot(.data) +
      geom_point(aes(carat, price, color=cut), alpha = 0.3, size = 0.3) +
      theme_bw() +
      labs(title = title) +
      theme_bw(theme_size) +
      theme(axis.text = element_blank(), legend.position = 'none') +
      scale_color_manual(values = c('Fair'="#1B9E77", 'Good'="#D95F02", 'Very Good'="#7570B3",
                                    'Premium'="#E7298A", 'Ideal'="#66A61E"))
}
create_plot(diamonds)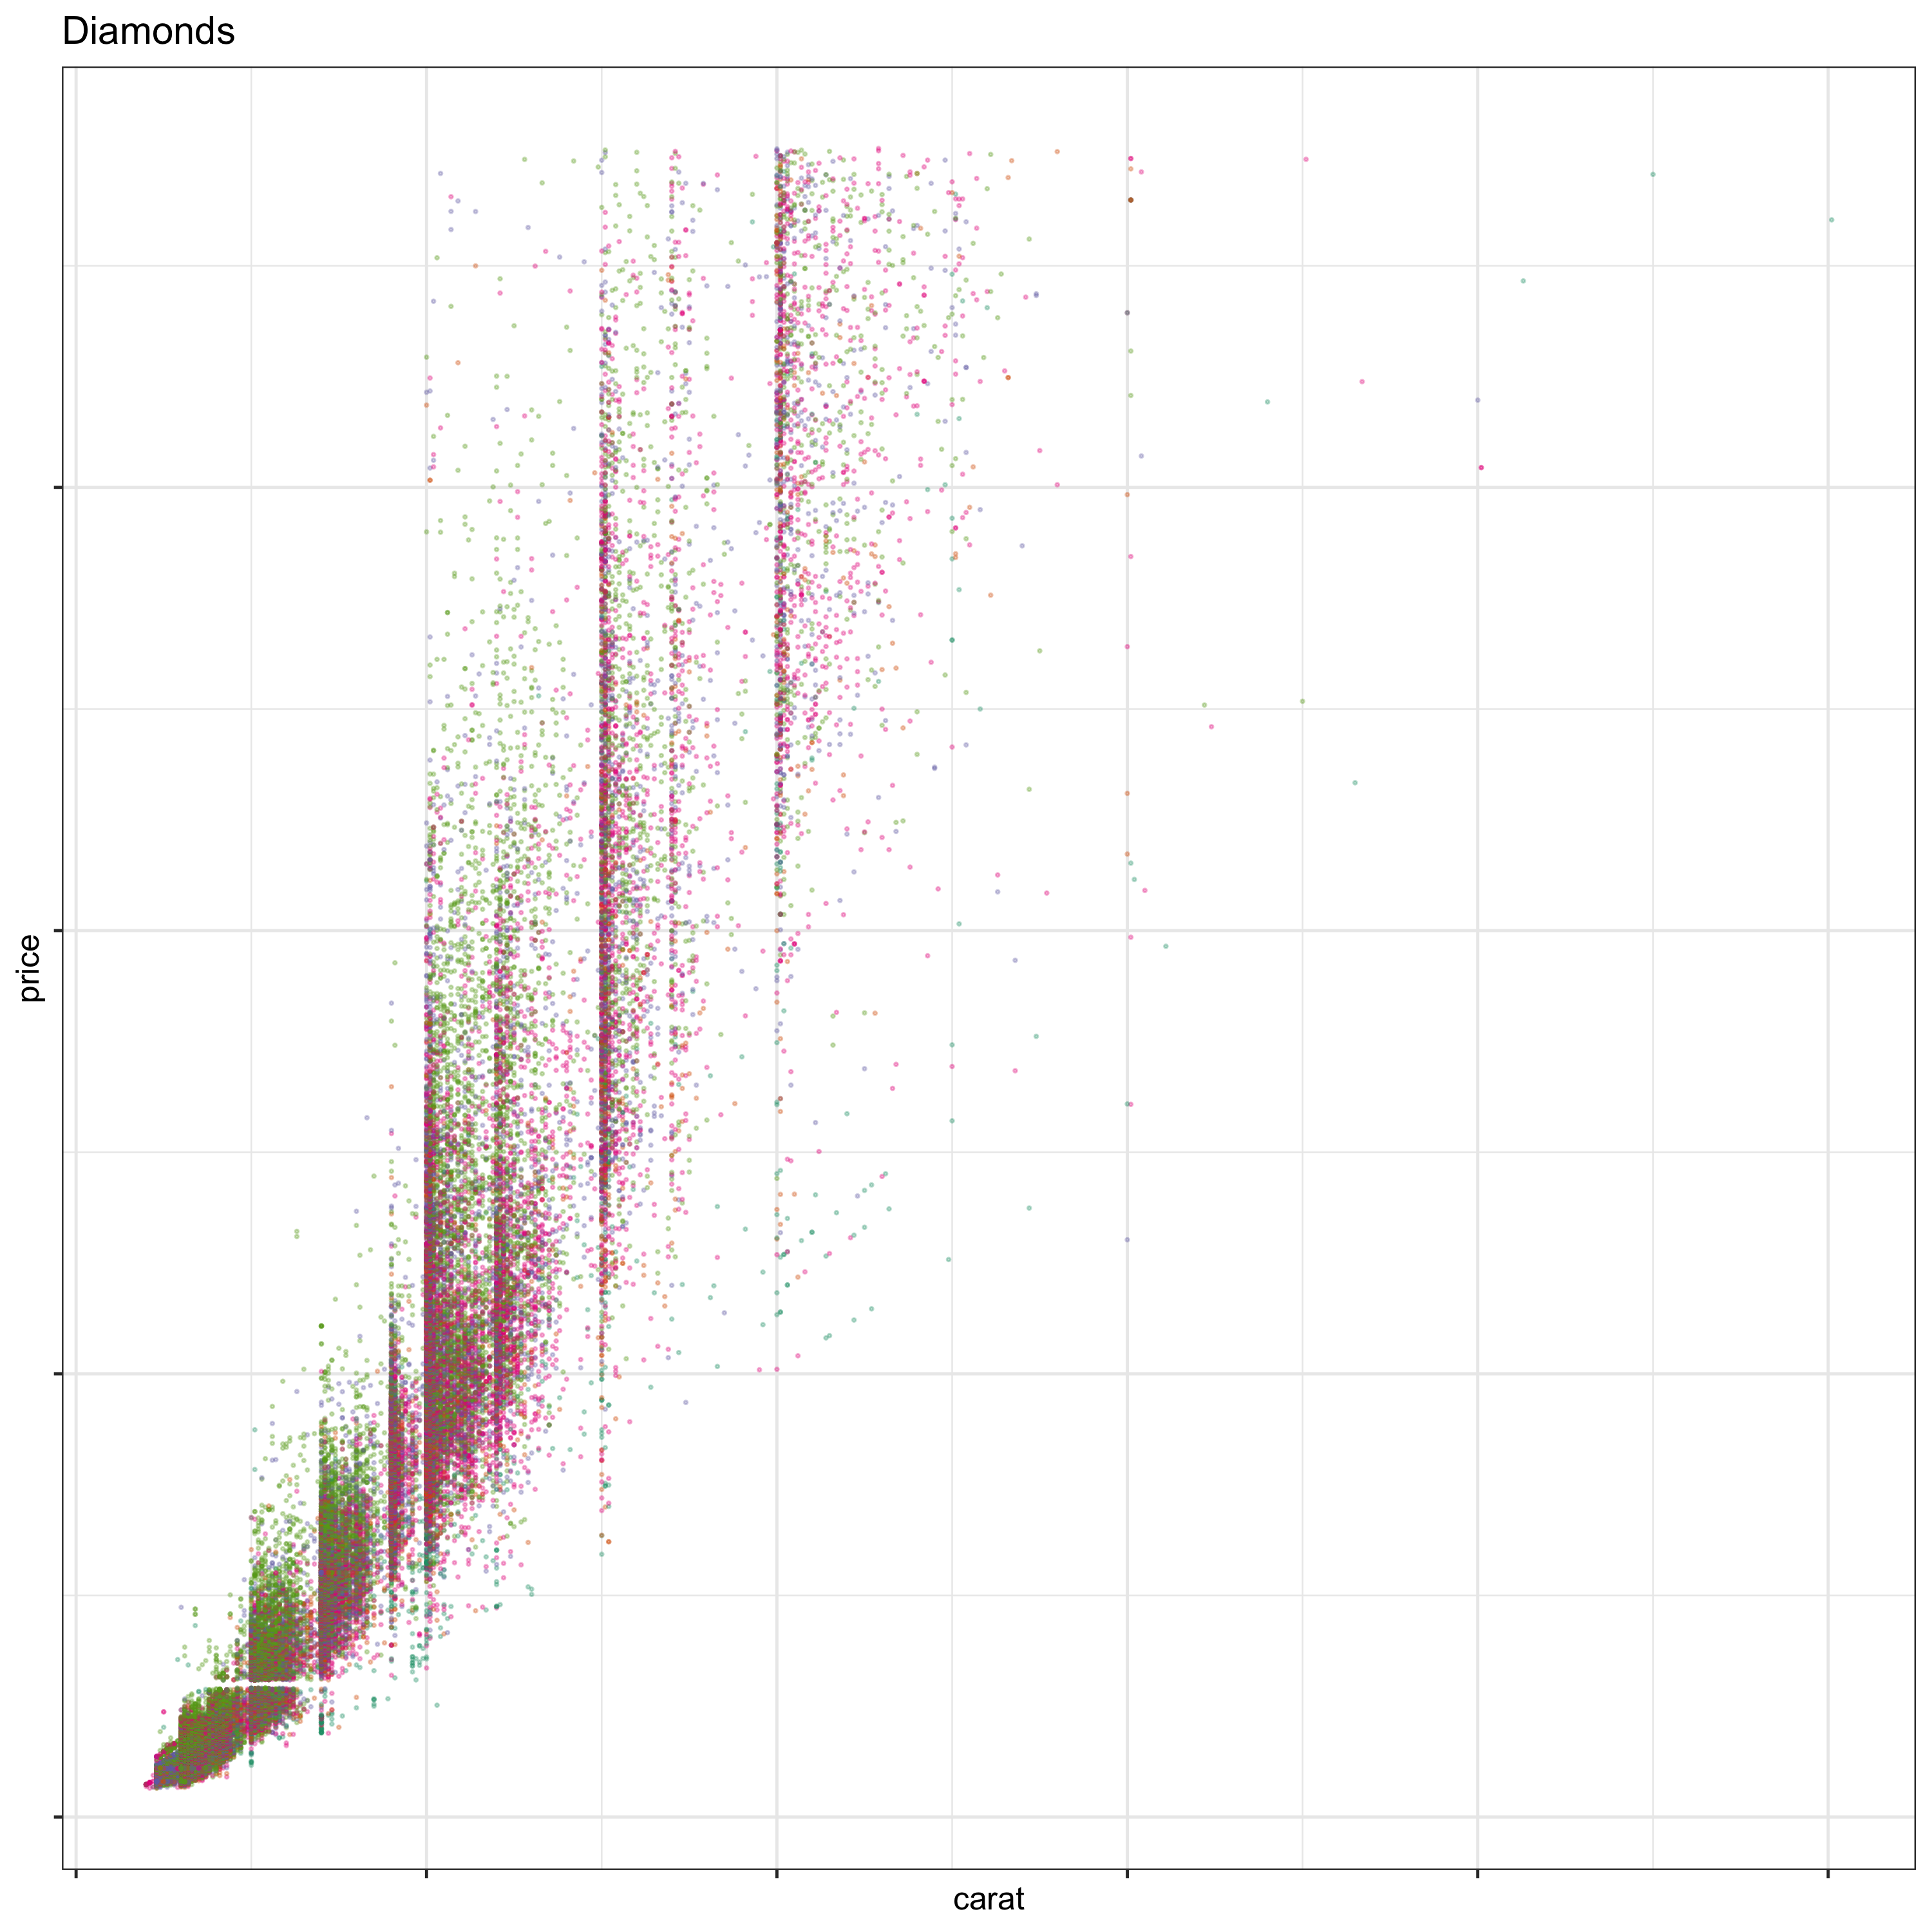
facet_inception()
#~~~~~~~~~~~~~~~~~~~~~~~~~~~~~~~~~~~~~~~~~~~~~~~~~~~~~~~~~~~~~~~~~~~~~~~~~~~~~
#' Create a nested facetted plot
#'
#' @param .data data.frame
#' @param cols character vector of columns to use for facetting
#' @param title title for plot
#' @param theme_size the base size for the theme
#~~~~~~~~~~~~~~~~~~~~~~~~~~~~~~~~~~~~~~~~~~~~~~~~~~~~~~~~~~~~~~~~~~~~~~~~~~~~~
facet_inception <- function(.data, cols, title = NULL, theme_size) {
  if (length(cols) == 1) {
    create_plot(.data, title, theme_size) +
      facet_wrap(cols[1], labeller = label_both)
  } else {
    this_col <- cols[1]
    cols     <- cols[-1]
    sub_data <- split(.data, .data[[this_col]])
    sub_plots <- sub_data %>%
      purrr::imap(~facet_inception(.x, cols, paste(title, paste0(this_col, ': ', .y), collapse = ", "), theme_size = theme_size))
    patchwork::wrap_plots(sub_plots)
  }
}
The diamonds data set: price vs carat - facetted by cut.
facet_inception(diamonds, c('cut'), theme_size = 12)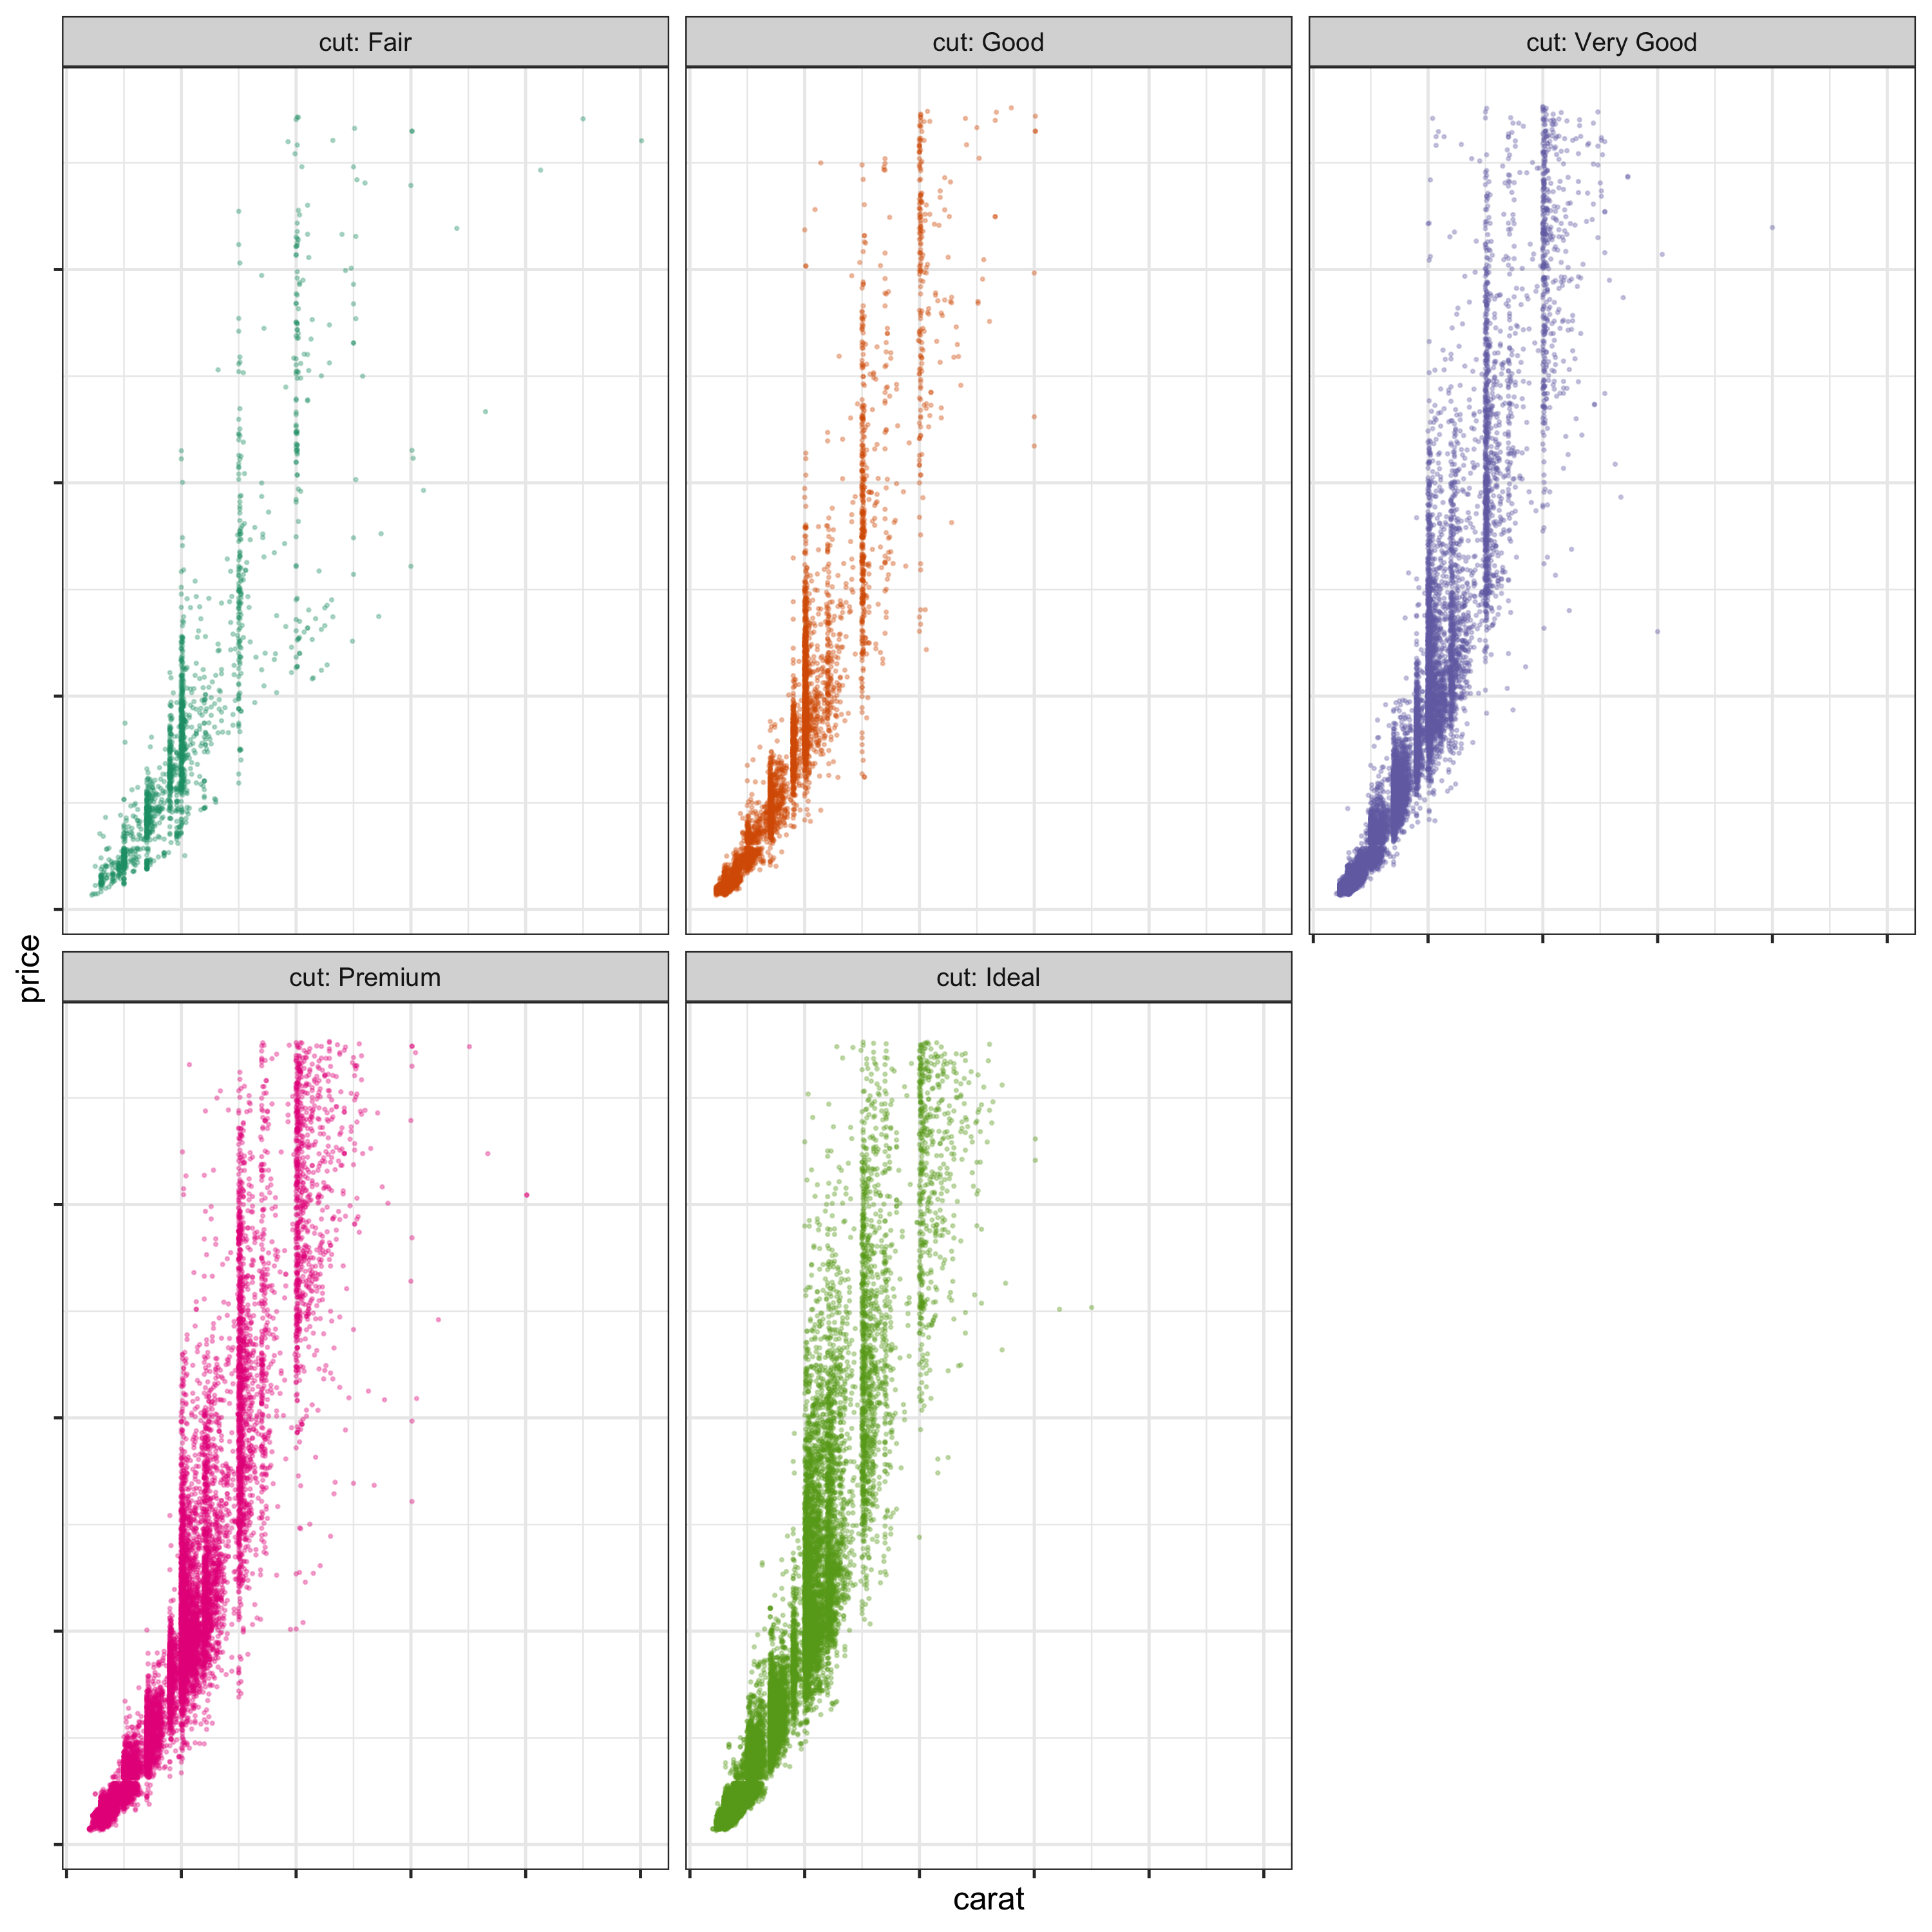
The diamonds data set: price vs carat - facetted by cut, then facetted within each cut by color
facet_inception(diamonds, c('cut', 'color'), theme_size = 12)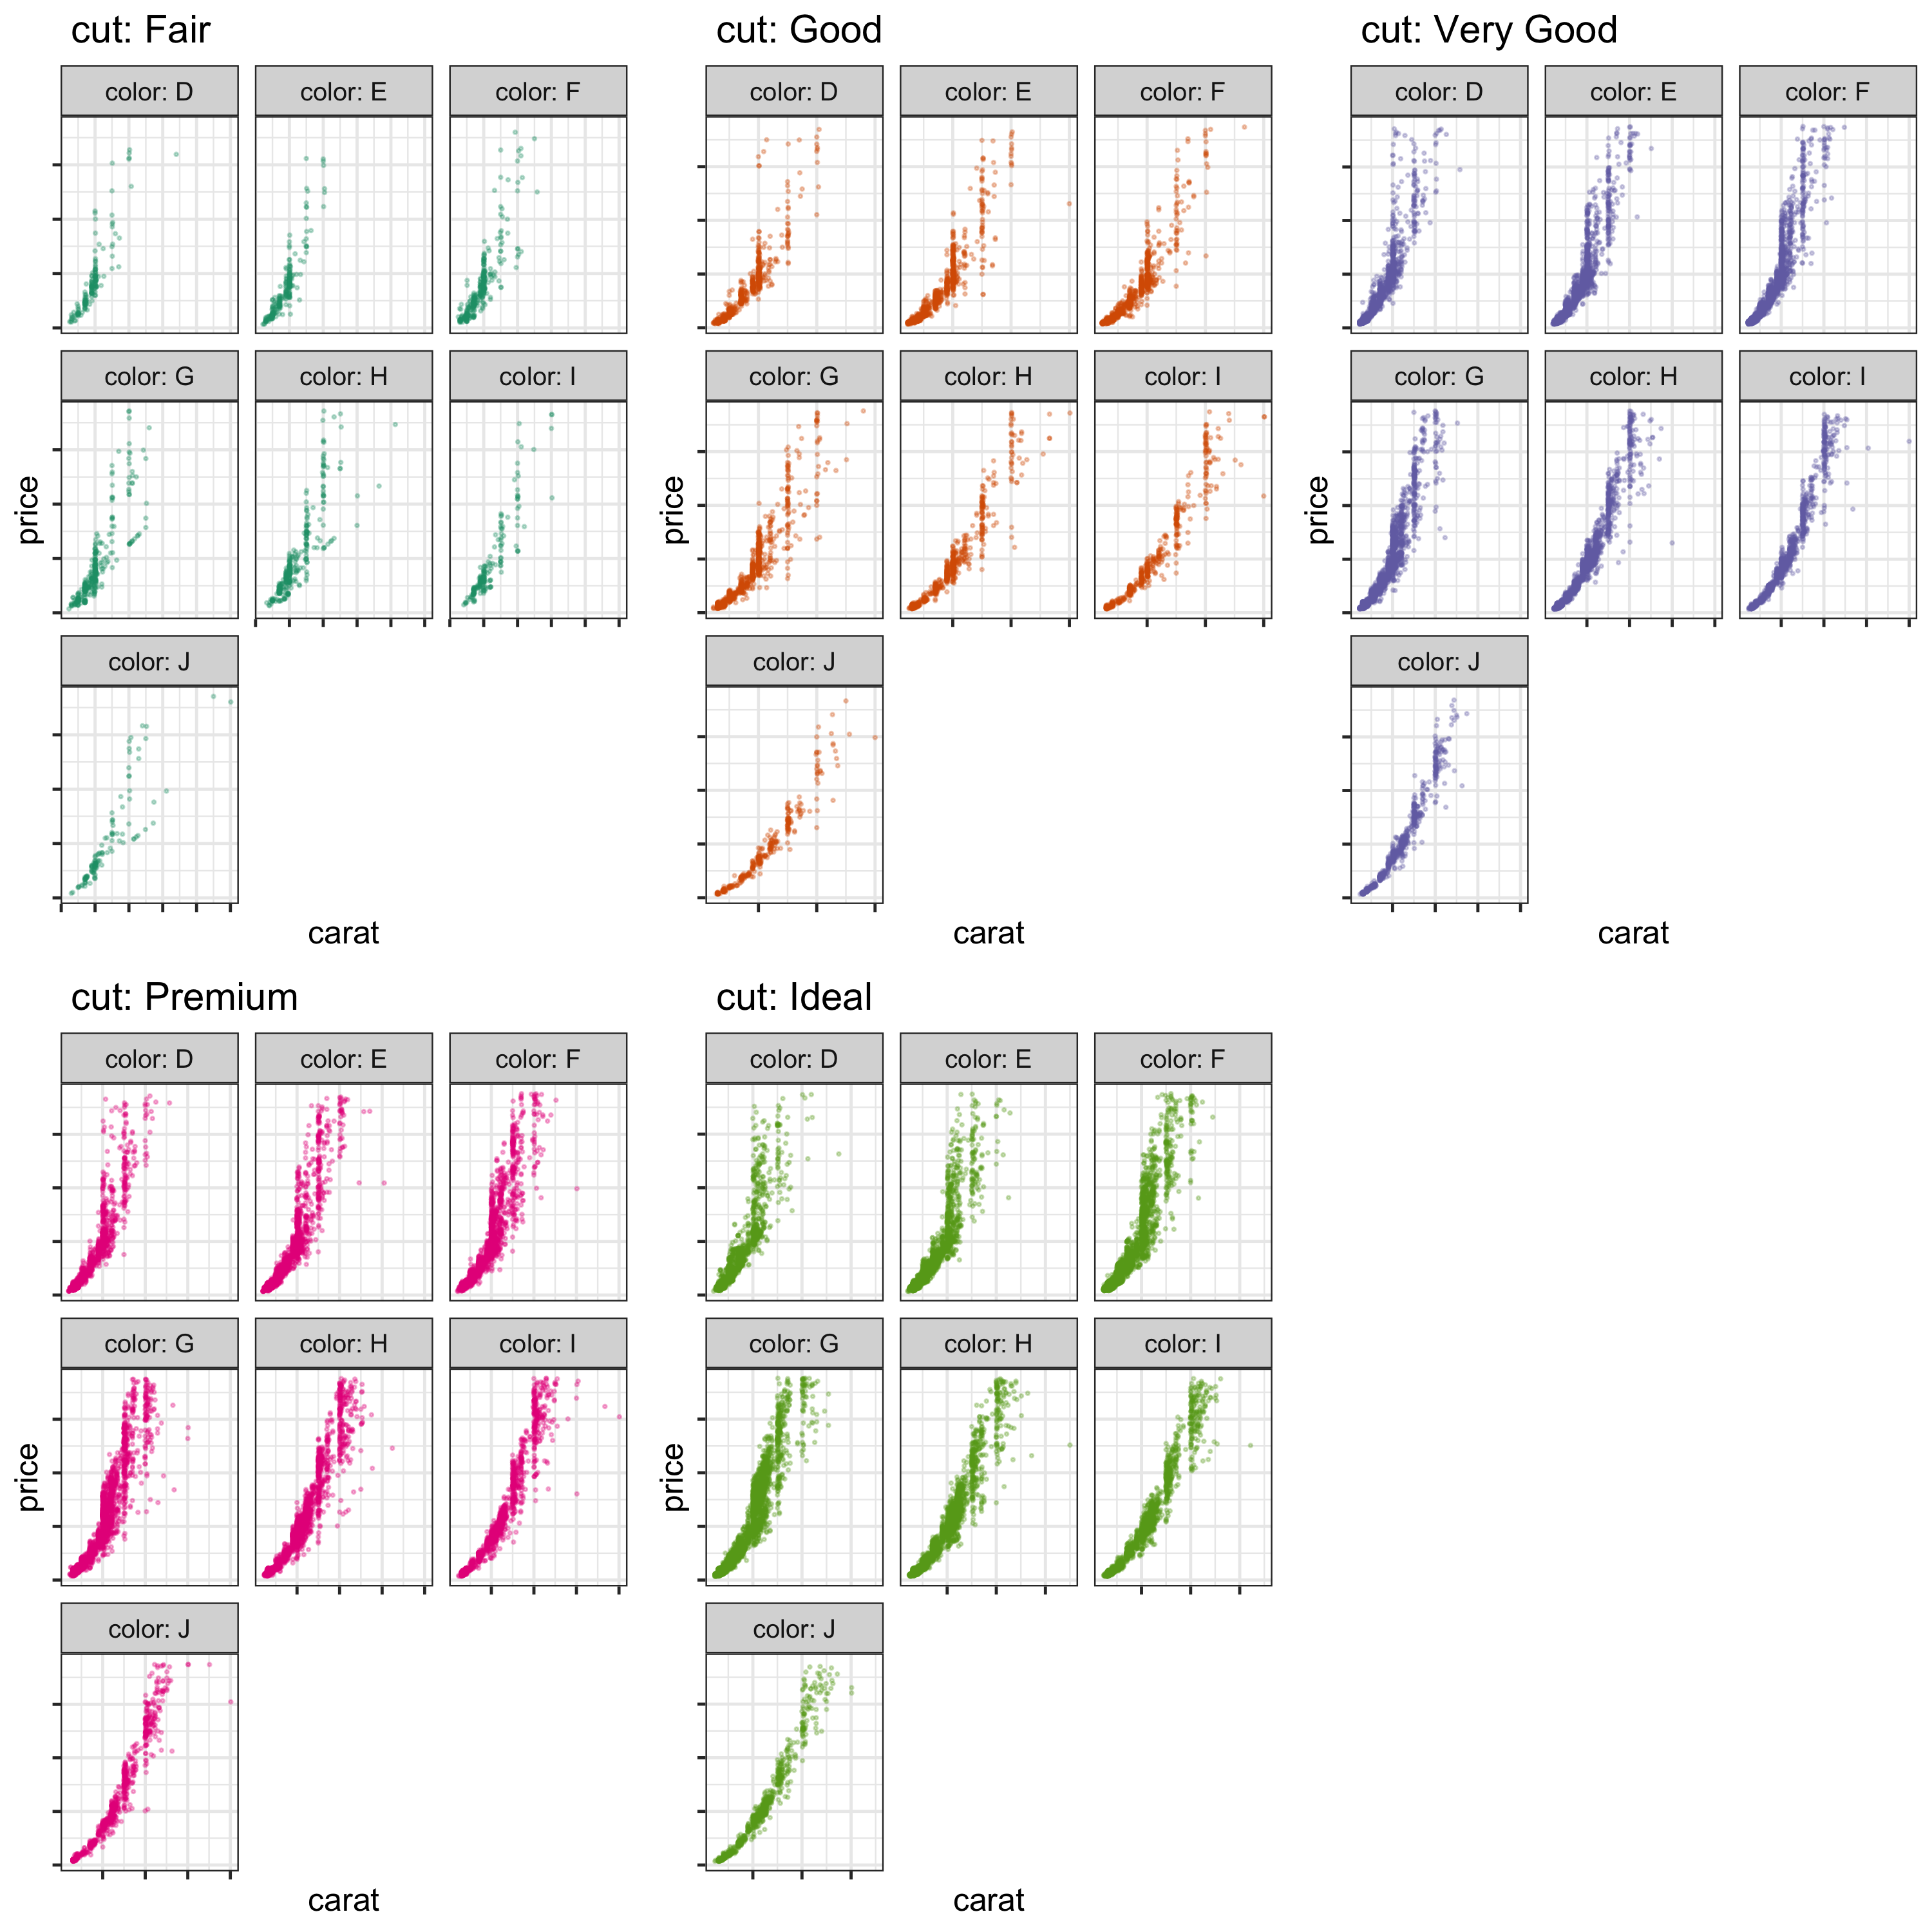
The diamonds data set: price vs carat - facetted by cut, then facetted within each cut by color, then each of those facets are factted by clarity.
facet_inception(diamonds, c('cut', 'color', 'clarity'), theme_size = 4)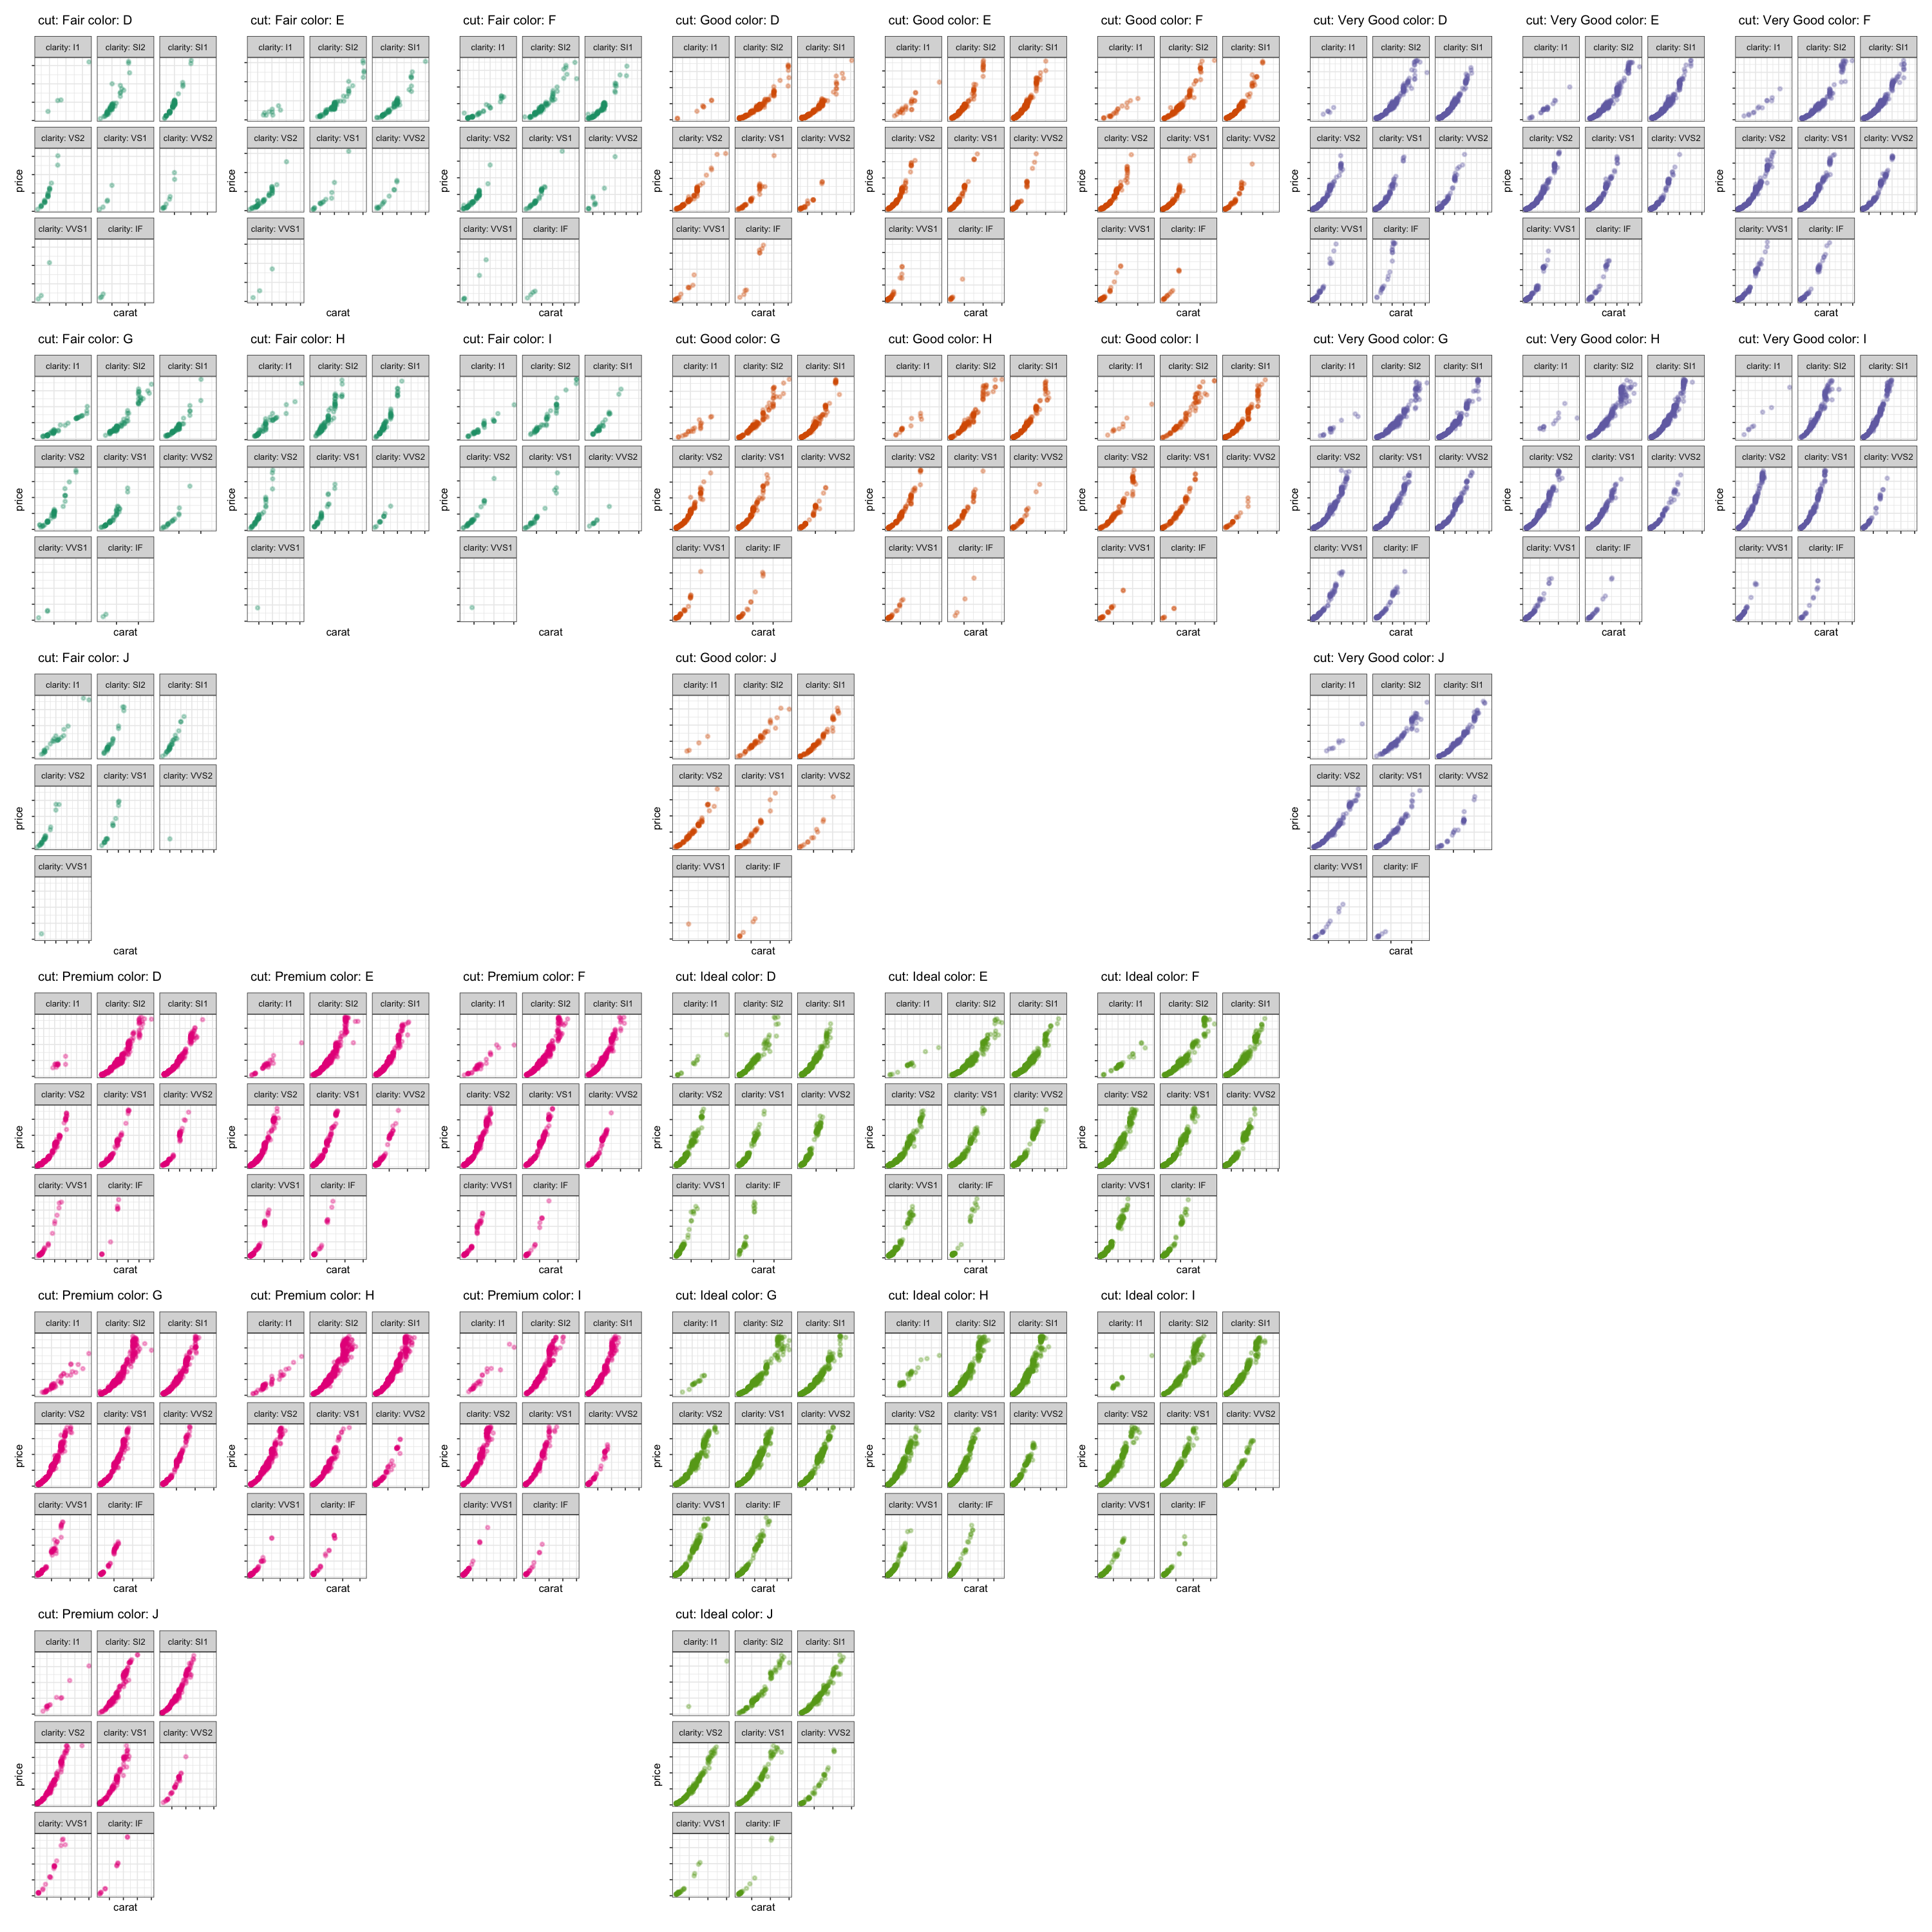
Animated Gif
