Drawing with epicycles
- Create a set of points to define the path
- Take the discrete fourier transform of the points (as represented in the complex plane)
- The magnitude and phase of the fourier transform components are the radius and phase offset of the circles to draw
library(ggplot2)
library(gganimate)
library(ggforce) # geom_circle
library(dplyr)
library(hershey) # vector font: https://github.com/coolbutuseless/hershey
Extract a set of points for the letter R
This uses the Hershey vector fonts.
#~~~~~~~~~~~~~~~~~~~~~~~~~~~~~~~~~~~~~~~~~~~~~~~~~~~~~~~~~~~~~~~~~~~~~~~~~~~~~
# Choose a character from a Hershey vector font and extract x and y coords
#~~~~~~~~~~~~~~~~~~~~~~~~~~~~~~~~~~~~~~~~~~~~~~~~~~~~~~~~~~~~~~~~~~~~~~~~~~~~~
char <- hershey::hershey %>%
  filter(font == 'futural', char == 'R')

x <- char$x
y <- char$y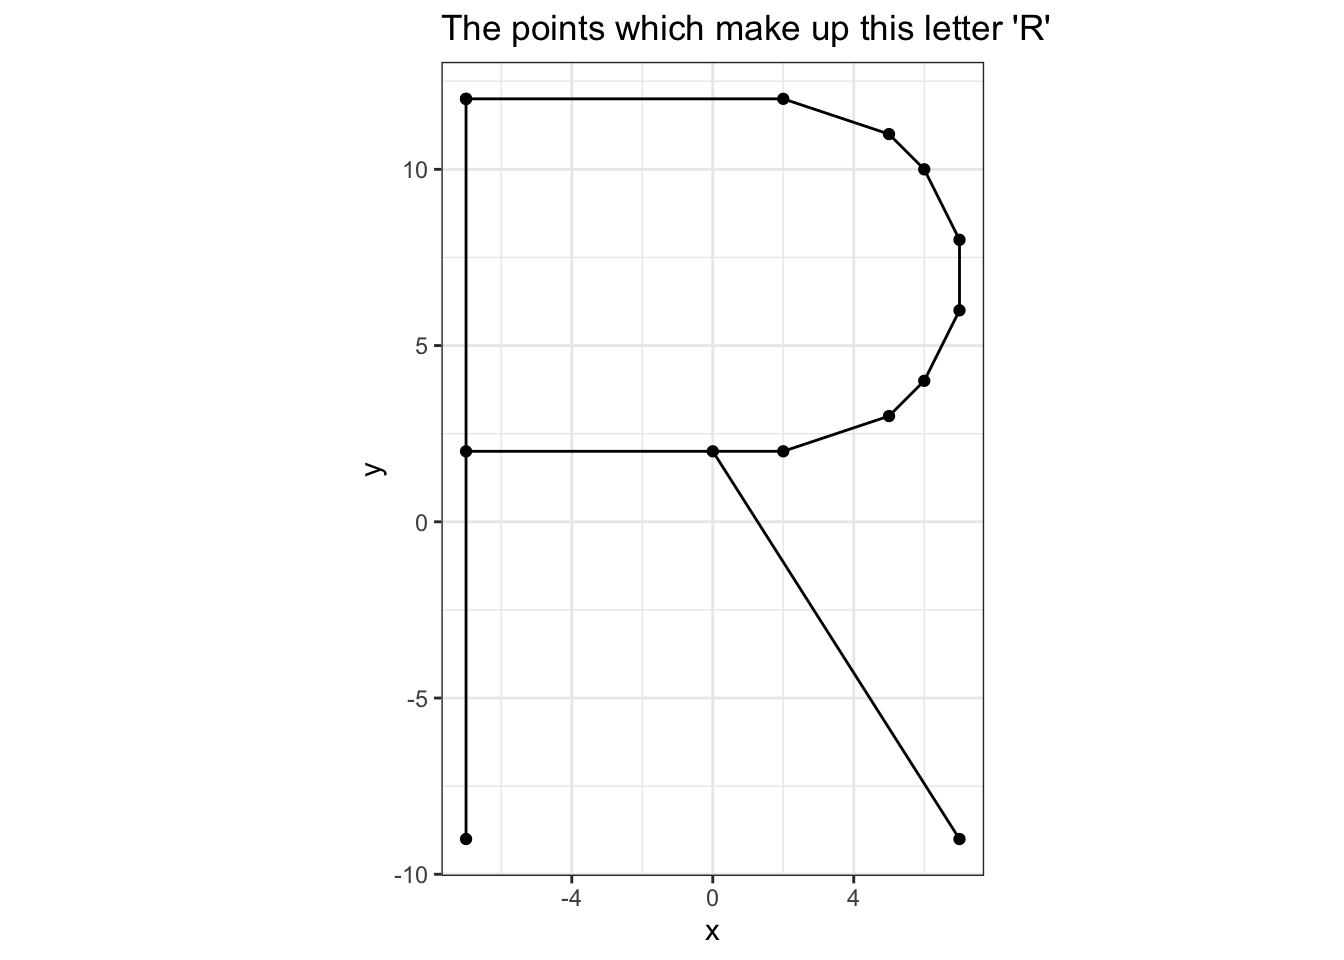
FFT of the (x,y) coordinates
#~~~~~~~~~~~~~~~~~~~~~~~~~~~~~~~~~~~~~~~~~~~~~~~~~~~~~~~~~~~~~~~~~~~~~~~~~~~~~
# Calculate a fourier transform of the points in the complex plane
#~~~~~~~~~~~~~~~~~~~~~~~~~~~~~~~~~~~~~~~~~~~~~~~~~~~~~~~~~~~~~~~~~~~~~~~~~~~~~
f <- fft(complex(real = x, imaginary = y))


#~~~~~~~~~~~~~~~~~~~~~~~~~~~~~~~~~~~~~~~~~~~~~~~~~~~~~~~~~~~~~~~~~~~~~~~~~~~~~
# From the FFT, calculate
# -  R     - radius
# -  phi   - phase shift
# -  omega - angular velocity
#~~~~~~~~~~~~~~~~~~~~~~~~~~~~~~~~~~~~~~~~~~~~~~~~~~~~~~~~~~~~~~~~~~~~~~~~~~~~~
N     <- length(x)
R     <- Mod(f) / N
phi   <- Arg(f)
omega <- 2 * pi * seq(0, N-1) / N
Construct the epicycles at each timestep
#~~~~~~~~~~~~~~~~~~~~~~~~~~~~~~~~~~~~~~~~~~~~~~~~~~~~~~~~~~~~~~~~~~~~~~~~~~~~~
# Debug/Sanity check:
# Recreate the original points by manually doing the inverse fourier transform.
# Generate points with timestamp so we can highlight in gganimate
#~~~~~~~~~~~~~~~~~~~~~~~~~~~~~~~~~~~~~~~~~~~~~~~~~~~~~~~~~~~~~~~~~~~~~~~~~~~~~
xs <- c()
ys <- c()

for (t in seq(0, N)) {
  xo <- R * cos(omega * t + phi)
  yo <- R * sin(omega * t + phi)

  xs <- c(xs, sum(xo))
  ys <- c(ys, sum(yo))
}

rpoints <- data.frame(x = xs, y = ys, t = as.numeric(seq(0, N)))


#~~~~~~~~~~~~~~~~~~~~~~~~~~~~~~~~~~~~~~~~~~~~~~~~~~~~~~~~~~~~~~~~~~~~~~~~~~~~~
# Create a data.frame of the cumulative sum of the components at
# each timepoint.  This will give us the position of each of the circle
# centres at each time point
#~~~~~~~~~~~~~~~~~~~~~~~~~~~~~~~~~~~~~~~~~~~~~~~~~~~~~~~~~~~~~~~~~~~~~~~~~~~~~
reconstruction <- list()

F <- 40  # how many steps between each input point

for (t in seq(0, N * F)) {
  t  <- t/F
  xo <- R * cos(omega * t + phi)
  yo <- R * sin(omega * t + phi)

  xc <- cumsum(xo)
  yc <- cumsum(yo)

  reconstruction[[length(reconstruction) + 1]] <- data.frame(x = xc, y = yc, t = t, R = R)
}

reconstruction <- do.call(rbind, reconstruction)

centres <- reconstruction %>%
  group_by(t) %>%
  mutate(R = lead(R)) %>%
  ungroup()
Plot epicycles at a single instant
#~~~~~~~~~~~~~~~~~~~~~~~~~~~~~~~~~~~~~~~~~~~~~~~~~~~~~~~~~~~~~~~~~~~~~~~~~~~~~
# Plot
#~~~~~~~~~~~~~~~~~~~~~~~~~~~~~~~~~~~~~~~~~~~~~~~~~~~~~~~~~~~~~~~~~~~~~~~~~~~~~
cdf <- reconstruction %>% filter(t == 0)
centres <- centres %>% filter(t == 0)
p <- ggplot() +
  geom_path(data = cdf, aes(x, y), alpha = 0.3) +
  geom_circle(data = centres, aes(x0 = x, y0 = y, r = R), na.rm = TRUE, colour = '#00000030') +
  geom_path(data = char, aes(x, y, group = stroke), size = 0.5, colour = 'black') +
  geom_point(data = char, aes(x, y), size = 1, colour = 'black') +
  geom_point(data = rpoints, aes(x, y), size = 3, colour = 'red') +
  theme_void() +
  coord_equal()

p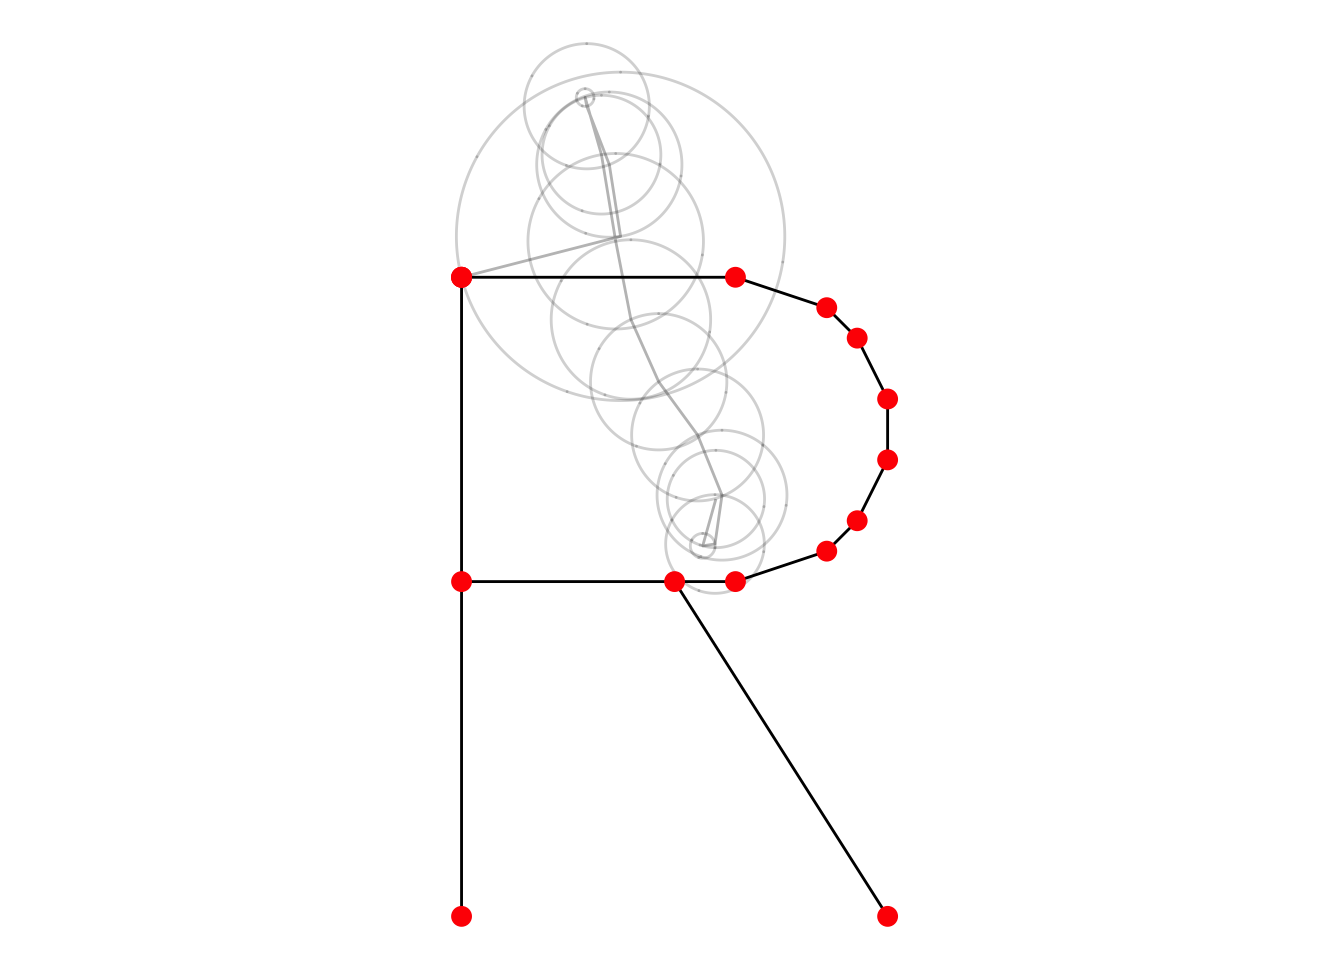
Animate the epicycles
#~~~~~~~~~~~~~~~~~~~~~~~~~~~~~~~~~~~~~~~~~~~~~~~~~~~~~~~~~~~~~~~~~~~~~~~~~~~~~
# Plot
#~~~~~~~~~~~~~~~~~~~~~~~~~~~~~~~~~~~~~~~~~~~~~~~~~~~~~~~~~~~~~~~~~~~~~~~~~~~~~
p <- ggplot() +
  geom_path(data = reconstruction, aes(x, y), alpha = 0.3) +
  geom_circle(data = centres, aes(x0 = x, y0 = y, r = R), na.rm = TRUE, colour = '#00000030') +
  geom_path(data = char, aes(x, y, group = stroke), size = 0.5, colour = 'black') +
  geom_point(data = char, aes(x, y), size = 1, colour = 'black') +
  geom_point(data = rpoints, aes(x, y), size = 3, colour = 'red') +
  theme_void() +
  coord_equal()
#~~~~~~~~~~~~~~~~~~~~~~~~~~~~~~~~~~~~~~~~~~~~~~~~~~~~~~~~~~~~~~~~~~~~~~~~~~~~~
# animate
#~~~~~~~~~~~~~~~~~~~~~~~~~~~~~~~~~~~~~~~~~~~~~~~~~~~~~~~~~~~~~~~~~~~~~~~~~~~~~
ga <- p + transition_manual(t)
a <- gganimate::animate(ga, nframes = N*F+1, fps = 20)
gganimate::anim_save("r.gif", a)