Problem
I often need to create complicated plots within a function.
A dataset is passed in to the function, then I do some data transformation and then create a multilayered/complicated plot.
I then set up the plot to have good default colours, aesthetics etc.
However sooner or later, I’ll want to override the defaults or add some extra styling.
This post details how these plotting functions start and how they end up.
I’m also keen to hear how others approach this problem.
Example - start
The following illustrates the idea - a plot created within a function.
As you can see, I’ve customised the presentation perfectly(!) and hard-coded the colour and size of the points.
create_super_plot <- function() {
  ggplot(mtcars) +
    geom_line(aes(mpg, wt, group=cyl)) +
    geom_point(aes(mpg, wt), colour='blue', size=2)
}
create_super_plot()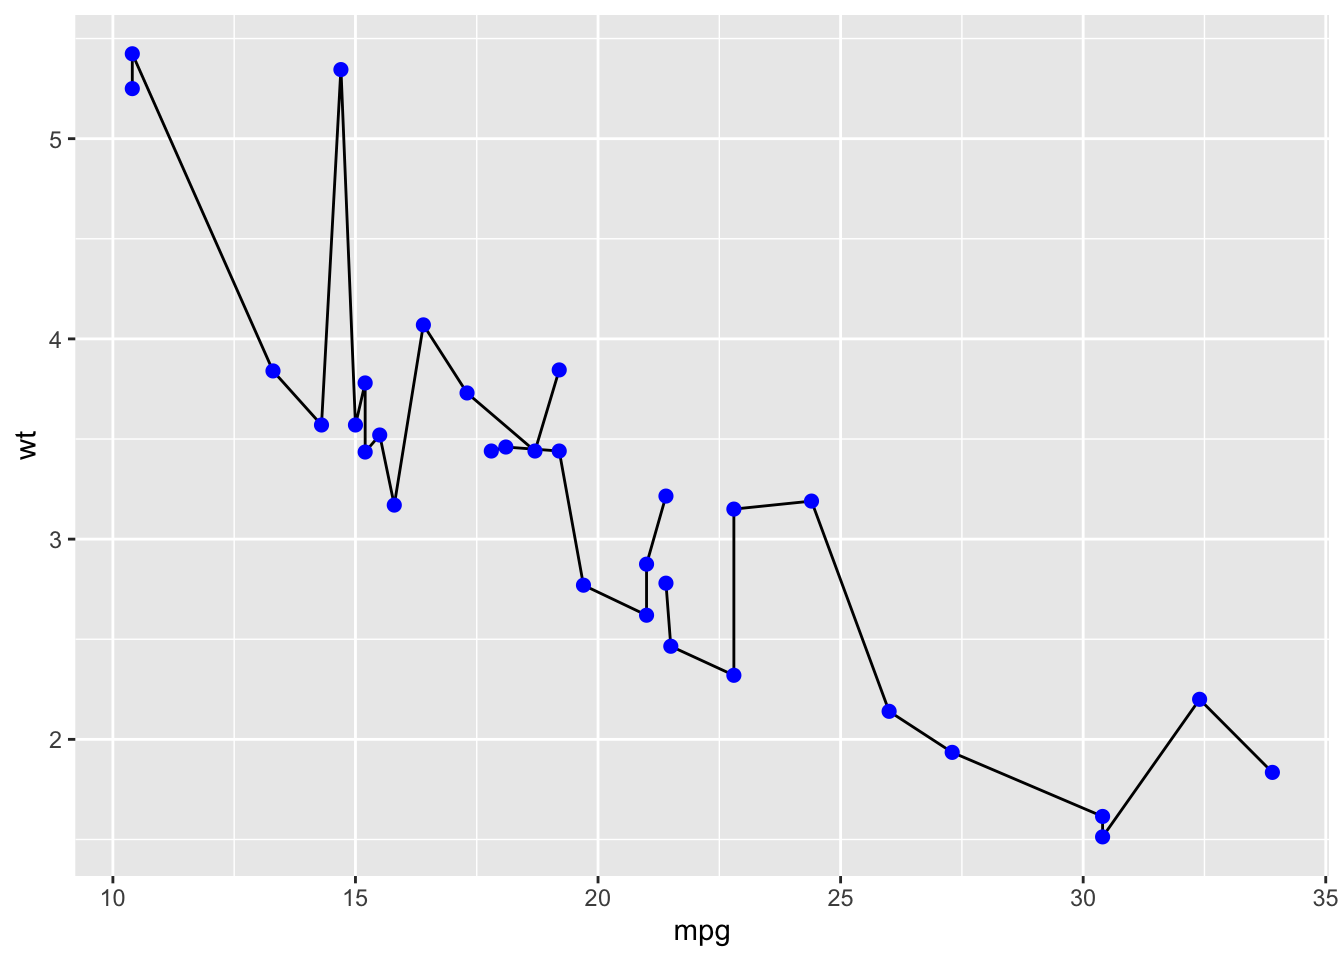
Example - round 2
Now that I have this perfect plot all wrapped in a function, I realise I need to customise it:
- I want to change the colour of the lines
- I want to change the colour of the points
- I want larger points
So I adapt the function to take these as arguments…
create_super_plot <- function(line_colour='black', point_colour='blue', point_size=3) {
  ggplot(mtcars) +
    geom_line(aes(mpg, wt, group=cyl), colour=line_colour) +
    geom_point(aes(mpg, wt), colour=point_colour, size=point_size)
}

create_super_plot(point_colour='red', point_size = 10)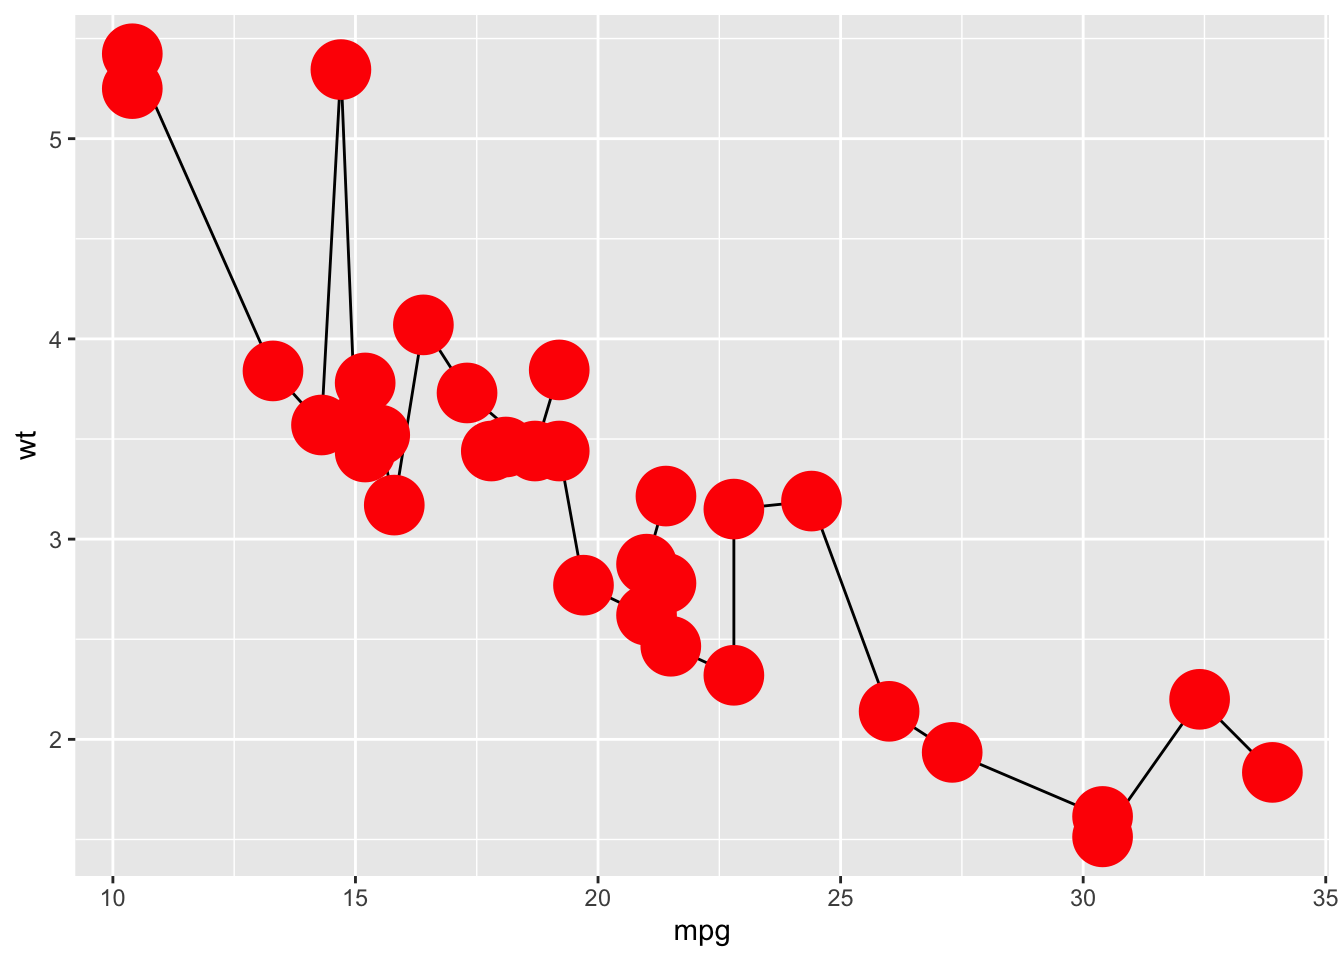
Example - round 3
After using the function for a while, and adding customisation possiblities as I need them, I end up with the following code - where there is now an option for every single aesthetic for every single geom!
This is unwieldy, and gets worse if there are more geoms or multiples of the same geom on the same plot.
create_super_plot <- function(
  point_shape   = 19,
  point_colour  = 'blue',
  point_size    = 1.5,
  point_fill    = NA,
  point_alpha   = NA,
  point_stroke  = 0.5,
  line_colour   = 'black',
  line_size     = 0.5,
  line_linetype = 1,
  line_alpha    = NA
  ) {
  ggplot(mtcars) +
    geom_line(mapping   = aes(mpg, wt, group=cyl),
              colour    = line_colour,
              size      = line_size,
              linetype  = line_linetype,
              alpha     = line_alpha) +
    geom_point(mapping = aes(mpg, wt),
               shape   = point_shape,
               colour  = point_colour,
               size    = point_size,
               fill    = point_fill,
               alpha   = point_alpha,
               stroke  = point_stroke)
}

create_super_plot(point_colour='red', point_size = 10)
Solution!
My workaround has been to define some helper functions which are just wrappers around ggplot geoms.
The user arguments to the geom are supplied in a list called aes_override, and
when calling the actual geom, these user arguments override the default arguments.
This means that we no longer have to specify every single aesthetic for every single geom in the outer function call!
geom_point_ <- function(..., aes_override=list()) {
  args <- modifyList(list(...), aes_override)
  do.call(geom_point, args)
}

geom_line_ <- function(..., aes_override=list()) {
  args <- modifyList(list(...), aes_override)
  do.call(geom_line, args)
}
create_super_plot <- function(line_aes=list(), point_aes=list()) {
ggplot(mtcars) +
geom_line_ (mapping = aes(mpg, wt, group=cyl), aes_override = line_aes ) +
geom_point_(mapping = aes(mpg, wt ), aes_override = point_aes)
}
create_super_plot(point_aes = list(colour='red', size=10))
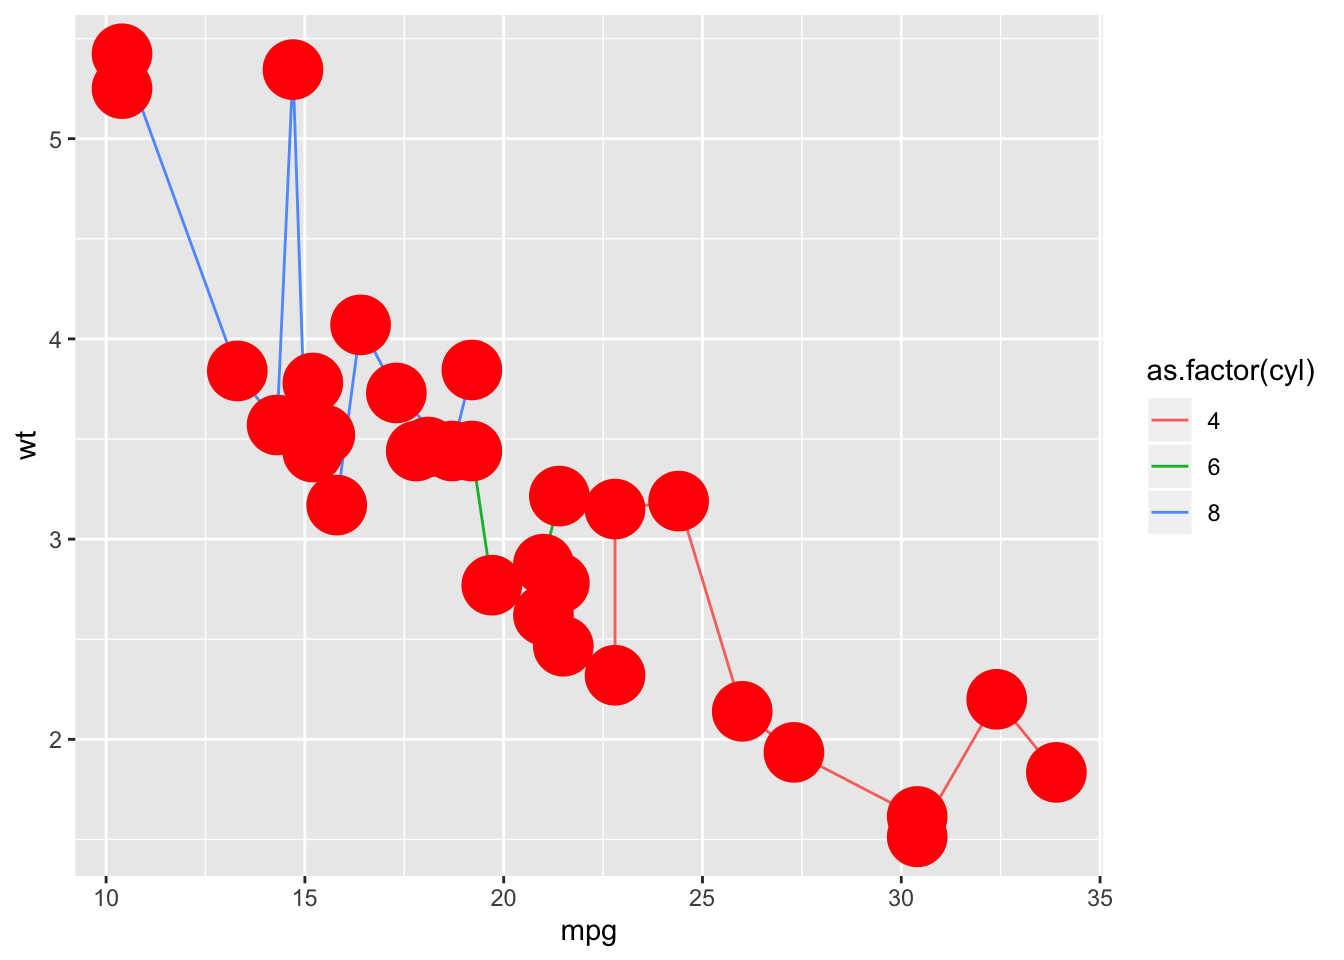
Solution - bonus features: I can also override the variable mapping!
As well as being able to override the static aesthetics, you can also override any aesthetic mapping (although it can be a bit trickier).
Here I change the default line mapping from group=cyl to colour=cyl.
create_super_plot(
  point_aes = list(colour='red', size=10),
  line_aes  = list(mapping=aes(mpg, wt, colour=as.factor(cyl)))
)
Is there a better way?
It seems like there should be a better way to do this. Is there?