Sometimes it doesn’t feel like a project (no matter how small!) is completed until there’s a package for it.
I wrapped up my previous post on using pipes with ggplot2 into the ggplot2pipes package.
In summary:
ggplot2pipesis a package for creating pipe-enabled versions ofggplot2functions.- You can find it on github.
- Install:
devtools::install_github("coolbutuseless/ggplot2pipes") - This supercedes the pipify package from 2015.
Basic Usage
- Call
init_ggplot2_pipes()to create all the pipe-enabled functions.- This will create a version of the ggplot function prefixed with “add_”, e.g. the function
geom_point()becomes the pipe-enabled function calledadd_geom_point()
- This will create a version of the ggplot function prefixed with “add_”, e.g. the function
- Use the new functions with dplyr/magrittr pipes
library(dplyr)
library(ggplot2)
library(ggplot2pipes)

init_ggplot2_pipes()

ggplot(mtcars) %>%
  add_geom_line(aes(mpg, wt)) %>%
  add_labs(title="hello") %>%
  add_theme_bw() %>%
  add_facet_wrap(~am)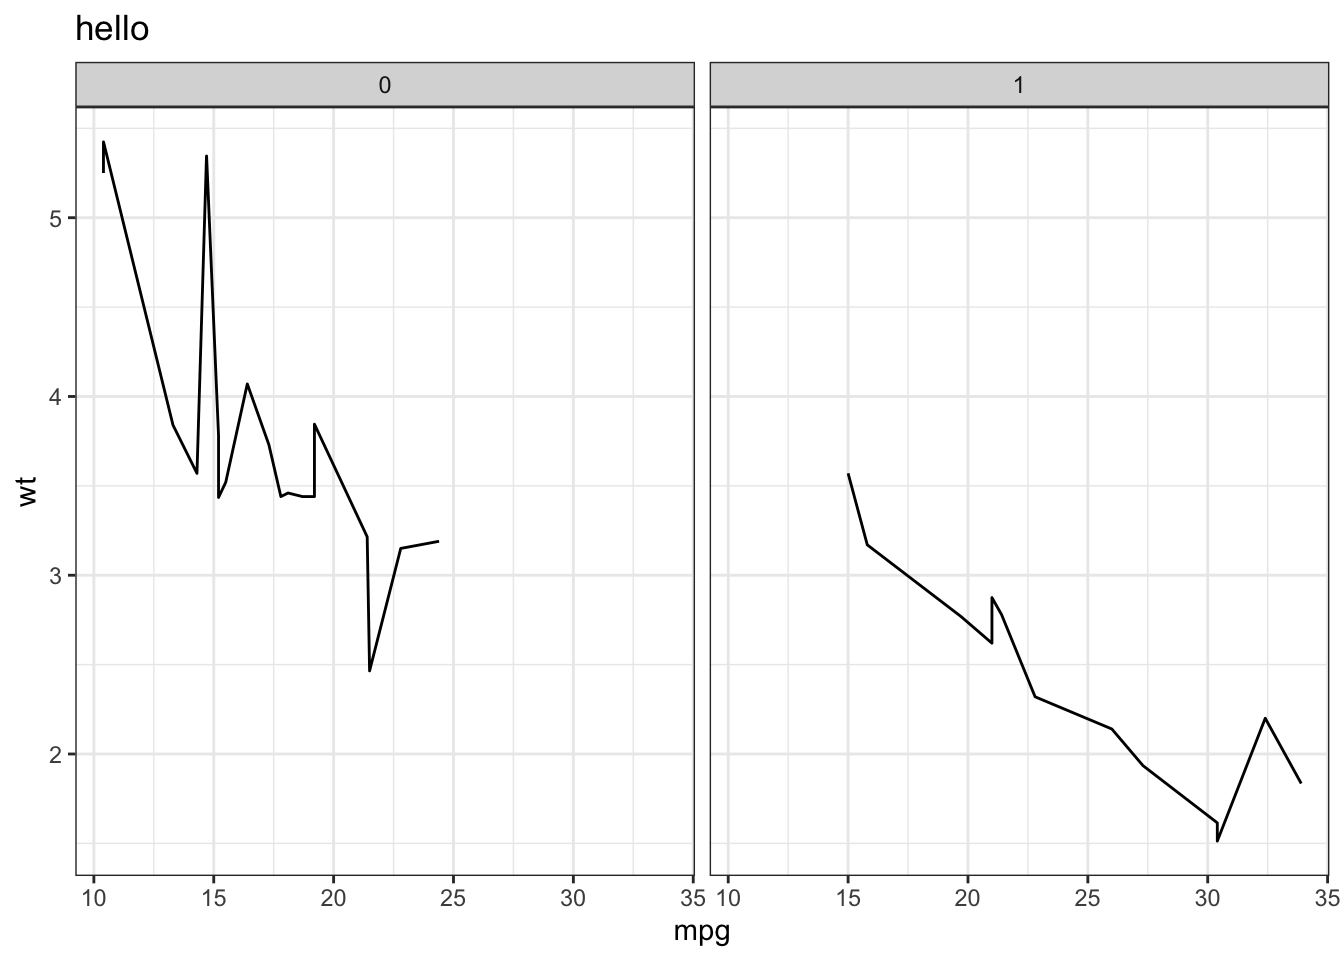
Advanced Usage
- The list of functions which are pipe-enabled is controlled by the regular expression argument
func_regex. By default this captures most geoms and stats and a few other core things. - The default prefix for the new pipe-enabled functions is
add_, but you can change this with theprefixargument. Note that theprefixcan even be set to the empty string if you want to try evil/confusing things like:
init_ggplot2_pipes(prefix='')

ggplot(mtcars) %>%
  geom_line(aes(mpg, wt)) %>%
  labs(title="hello") %>%
  theme_bw() %>%
  facet_wrap(~am)