Rationale
“That’s a compact and expressive DSL you have there for writing math equations given the constraints of the R language, it’d be a shame if someone were to expand it into an almost redundant and useless set of functions.” - #rstats mafia
Introduction
funcmath is a small library for building plotmath expressions via functions.
Some programmers use the term convenience functions i.e. “A convenience function is a non-essential subroutine in a programming library or framework which is intended to ease commonly performed tasks.”
funcmath is a set of inconvenience functions to expand the compact plotmath syntax
into a set of functions.
For example, instead of a nice compact plotmath expression such as:
m <- bquote(frac(alpha/beta, (1 + 2)))… why not use defined symbols in funcmath (such as alpha) and infix functions like %/%?
m <- frac(alpha %/% beta, b(1 %+% 2)) 
Installation
devtools::install_github('coolbutuseless/funcmath')Actual rationale
This work arose out of my attempts at creating fractals with plotmath expressions, and was not really meant as a way of creating actual math expressions.
Example #1
A plotmath expression created using bquote():
# http://lukemiller.org/index.php/2017/05/r-plotmath-functions-combined-with-variable-values/
mymean  <- 1.2345678
mySE    <- 0.55555
mylabel <- bquote(Delta*italic(T)[max]~.(format(mymean,digits=3))*''%+-%''*
                .(format(mySE,digits=2))*degree*C)
# plot(mylabel, cex=2)
The same plotmath expression created via funcmath:
Delta %*%
  italic('T') %_% 'max' %space% format(mymean,digits=3) %+-%
  (format(mySE,digits=2) %*% degree) %*% 'C' %>%
  plot(cex=2)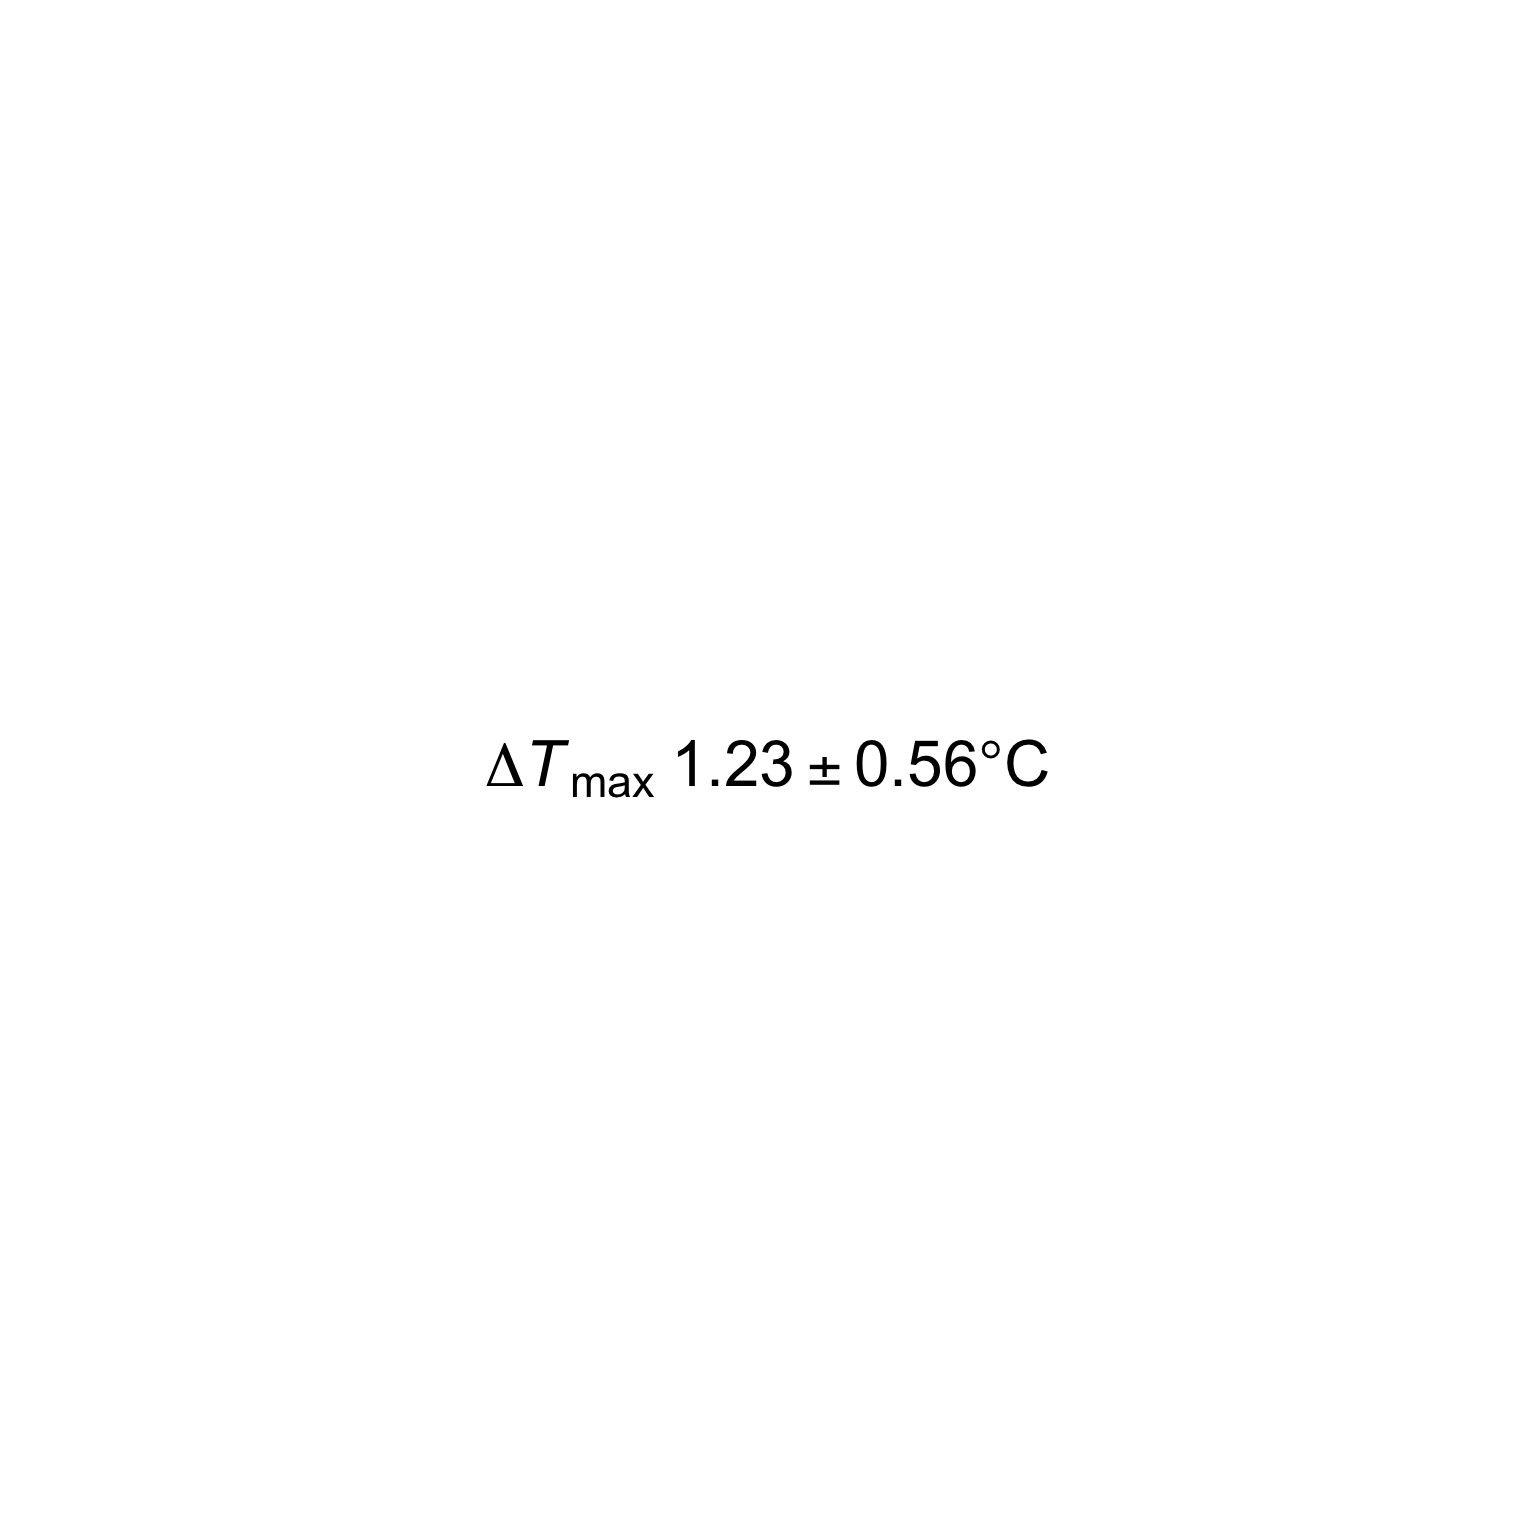
Example #2 - Sierpinski Fractal
s <- function(x) { x %_% x %^% x }

plot(s(s(s(mu))))
Example #3 - Beta distribution
An issue with the normal way of building plotmaths expressions is that it is usually all done in one statement, which makes debugging complex math problematic. e.g. beta distribution
# https://blog.snap.uaf.edu/2013/03/25/mathematical-notation-in-r-plots/
expr.beta <- expression(italic(paste(displaystyle(f(x)~"="~frac(Gamma(alpha+beta),Gamma(alpha)*Gamma(beta))*x^{alpha-1}*(1-x)^{beta-1})
                    ~~~~displaystyle(list(paste(0<=x) <=1, paste(0<alpha) <infinity, paste(0<beta) <infinity))
                    )))

plot(expr.beta, cex=1.25)
By exploding plotmath into a set of functions, funcmath allows you to compose individual parts of an math expression and then
combine them later. Individual parts can be tested separately and finally merged into the total required expression.
The result is more verbose, uglier and requires learning a whole new set of functions - this is called a win-win-win situation!
lhs          <- 'f' %*% b('x')
numerator    <- Gamma %*% b(alpha %+% beta)
denominator  <- (Gamma %*% b(alpha)) %*% (Gamma %*% b(beta))
right        <- 'x' %^% (alpha %-% 1) %*% b(1 %-% 'x') %^% (beta %-% 1)
limitx       <- 0 %<=%  'x'  %<=% 1
limitalpha   <- 0 %<<% alpha %<<% infinity
limitbeta    <- 0 %<<% beta  %<<% infinity

limits       <- list_(limitx, limitalpha, limitbeta)

total        <- lhs %eq% (numerator %frac% denominator) %*% right %space4% limits

styled_total <- italic(displaystyle(total))


plot(styled_total, cex=1.25)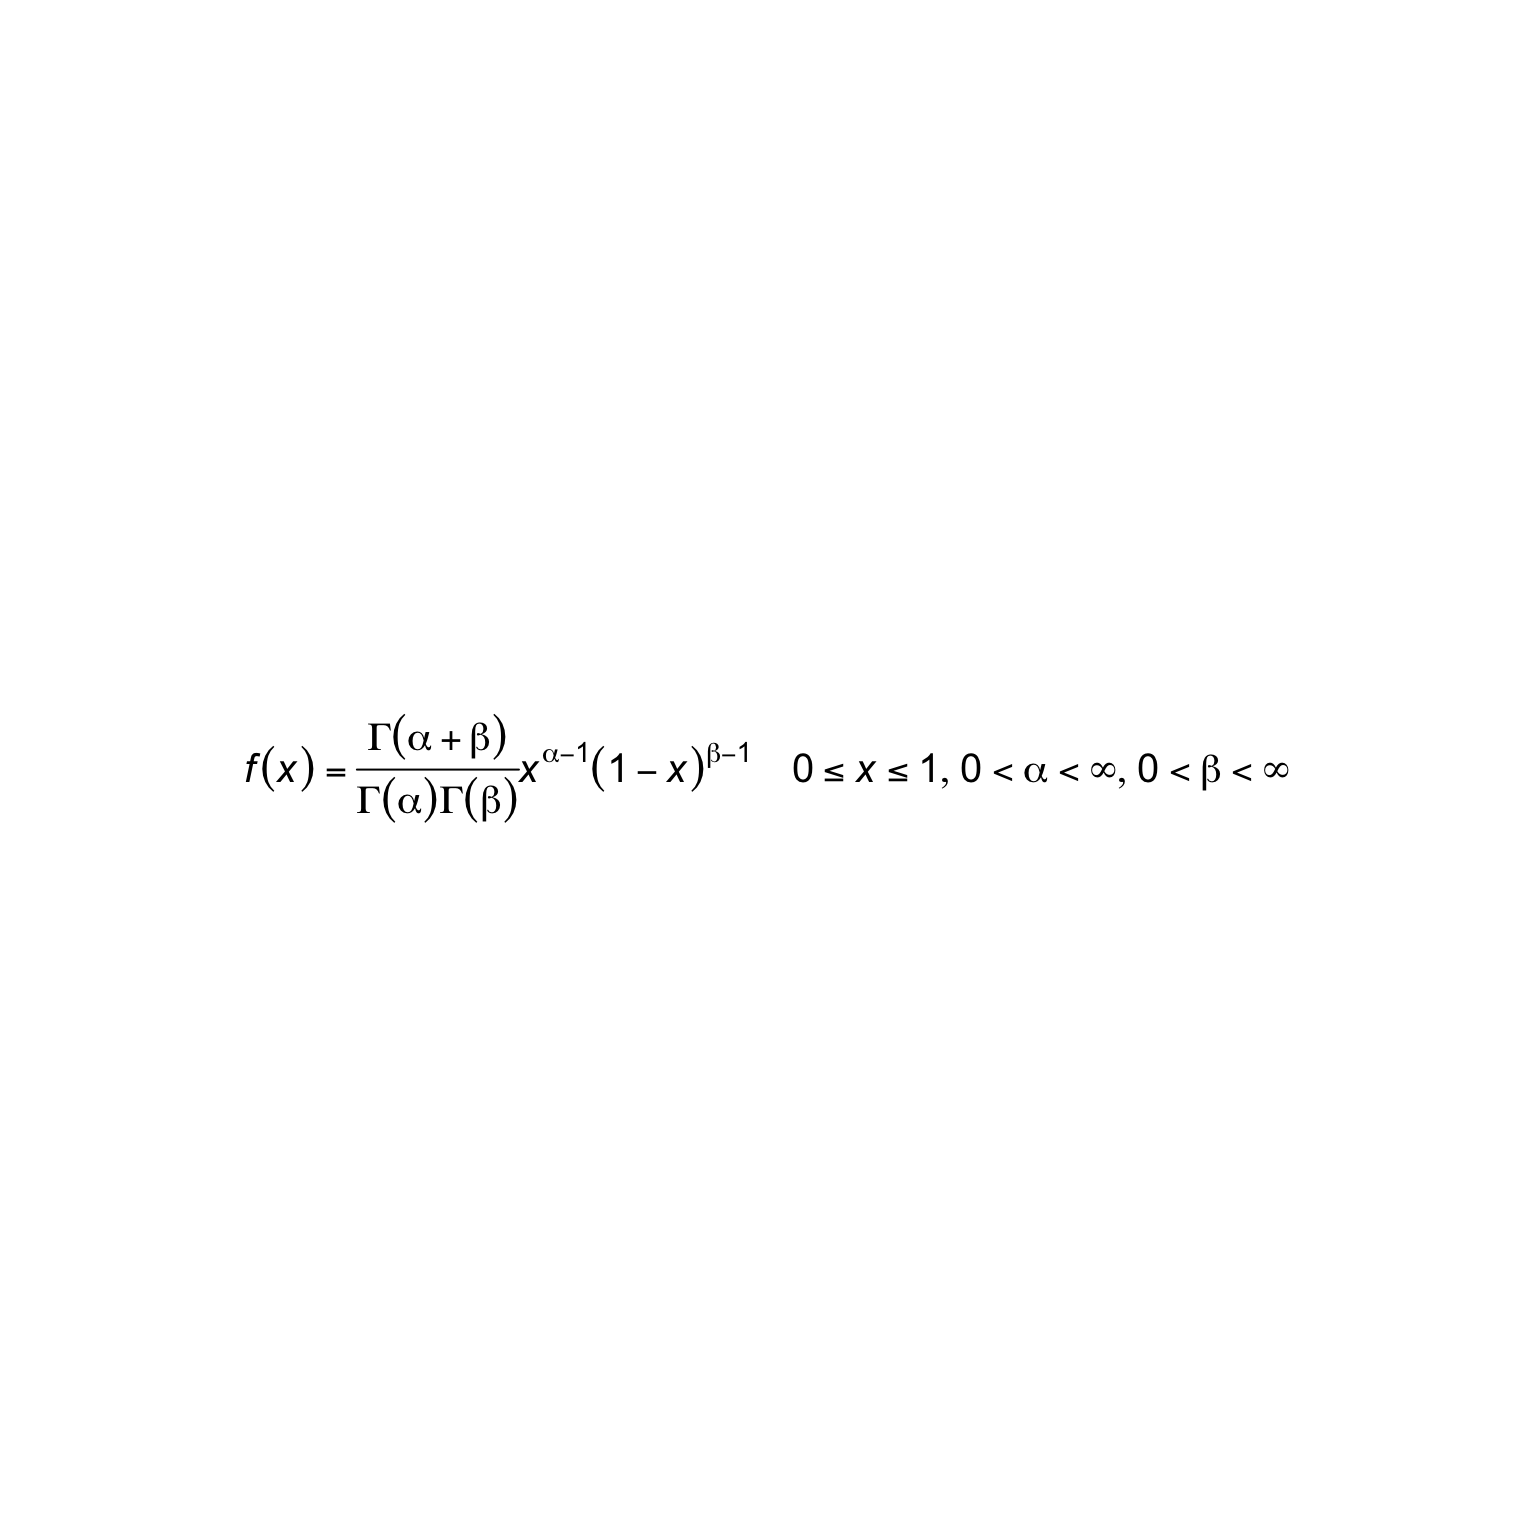
Turn the expression back into a parseable string
It is possible to turn the created plotmath back into a parseable character string.
pstring <- as_parseable_string(styled_total)
cat(pstring)italic({displaystyle({{{{{f}*{({x})}}=={frac({{Gamma}*{({{alpha}+{beta}})}},{{{Gamma}*{({alpha})}}*{{Gamma}*{({beta})}}})}}*{{{{x}^{{alpha}-{1}}}*{({{1}-{x}})}}^{{beta}-{1}}}}~{~{~{~{list({list({{{0}<={x}}<={1}},{{{0}<{alpha}}<{infinity}})},{{{0}<{beta}}<{infinity}})}}}}})})Issues
- There are a lot of namespace clashes e.g.
list,paste,%*%etc. - Some names have an appended underscore to avoid clashing with a builtin/common
function i.e.
list_instead oflist.