Introduction
Braille is a tactile writing system used by people who are visually impaired.
A pattern of 2x3 dots is used to encode symbols, letters, words and language. The current(?) standard(?) for the English language is Unified English Braille, although Nemeth Braille seems to be a slightly different standard which still appears popular for encoding mathematical notion.
Disclaimer:
- I’m only looking at simple Grade 1 encoding (i.e. letter-by-letter transcription)
- I realise there are Braille symbols in unicode, but I’m thinking beyond screen/paper representations, so I want to render my own symbols.
Braille subset - just the lowercase letters
Defining a Braille symbol
- A Braille symbol is made up of 6 dots.
- Therefore, we need only 6 bits to encode it
- Let’s round it up to 8 bits, and store the definition for each symbol in a byte.
- Assign each of the dots a numerical value.
- The numerical representation of a symbol is the sum of its dots
- e.g.
- the letter
gis represented by setting the upper 4 dots - sum of upper 4 dots = 1 + 2 + 4 + 8 = 15
- the letter
To turn a symbol back into a sequence of ON/OFF values, use intToBits e.g.
dots <- intToBits(15)[1:6]
matrix(dots, ncol=2, byrow=TRUE)
[,1] [,2]
[1,] 01 01
[2,] 01 01
[3,] 00 00Exploiting redundancy
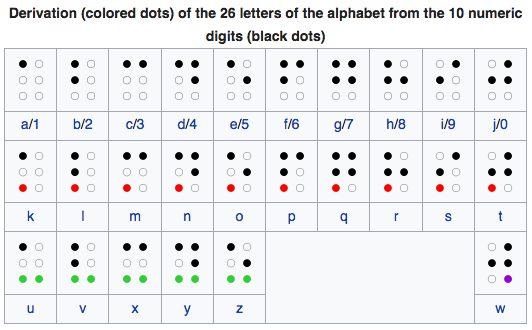
In the table of all the alphabet Braille symbols in the image above, you can see that the second set of 10 symbols is just a copy of the first set with the bottom left dot turned on.
Similarly the third set of 10 symbols is a copy of the first set but with both bottom dots turned on.
So for my current purposes, it’s only necessary to carefully define the first row, and then just calculate all other rows from it.
The alphabet
- Create the first 10 letters of the alphabet by summing the dots in each.
- Create subsequent rows by adding the extra dots that are set for that row.
set1 <- c(1, 5, 3, 11, 9, 7, 15, 13, 6, 14)
set2 <- set1 + 16
set3 <- set1 + 48
set4 <- set1 + 32

# Definition of the first 40 symbols
symbols <- c(set1, set2, set3, set4)

symbols
[1] 1 5 3 11 9 7 15 13 6 14 17 21 19 27 25 23 31 29 22 30 49 53 51 59 57
[26] 55 63 61 54 62 33 37 35 43 41 39 47 45 38 46Lookup table
For historical reasons, the letter w is totally out of sequence, so the mapping
from letter to symbol is a bit weird.
letter_to_symbol_idx <- setNames(1:26,letters)
letter_to_symbol_idx['w'] <- 40
letter_to_symbol_idx['x'] <- 23
letter_to_symbol_idx['y'] <- 24
letter_to_symbol_idx['z'] <- 25

letter_to_symbol_idx
a b c d e f g h i j k l m n o p q r s t u v w x y z
1 2 3 4 5 6 7 8 9 10 11 12 13 14 15 16 17 18 19 20 21 22 40 23 24 25 Simple Braille Renderer (Grade 1)
Split a word into characters and find all the symbols for these characters
this_word     <- "braille"
chars         <- strsplit(tolower(this_word),'')[[1]]
symbol_idx    <- letter_to_symbol_idx[chars]
these_symbols <- symbols[symbol_idx]

these_symbols
[1] 5 29 1 6 21 21 9Turn the symbols into ON/OFF dot definitions
dots <- these_symbols %>% map(~intToBits(.x)[1:6] > 0)
dots
[[1]]
[1] TRUE FALSE TRUE FALSE FALSE FALSE
[[2]]
[1] TRUE FALSE TRUE TRUE TRUE FALSE
[[3]]
[1] TRUE FALSE FALSE FALSE FALSE FALSE
[[4]]
[1] FALSE TRUE TRUE FALSE FALSE FALSE
[[5]]
[1] TRUE FALSE TRUE FALSE TRUE FALSE
[[6]]
[1] TRUE FALSE TRUE FALSE TRUE FALSE
[[7]]
[1] TRUE FALSE FALSE TRUE FALSE FALSECreate a data frame of dots positions
# Define x and y positions of each dot
x <- c(0, 1, 0, 1, 0, 1)
y <- c(2, 2, 1, 1, 0, 0)


# merge each dot with its (x, y) coordiante,
# and add some spacing to the x cordinate so that
# the characters appear one after the other
plot_df <- data.frame(
  dot = unlist(dots),
  x   = x + rep(seq(dots), e=6) * 3,
  y   = y
)

knitr::kable(head(plot_df))| dot | x | y |
|---|---|---|
| TRUE | 3 | 2 |
| FALSE | 4 | 2 |
| TRUE | 3 | 1 |
| FALSE | 4 | 1 |
| FALSE | 3 | 0 |
| FALSE | 4 | 0 |
ggplot
# Simple plot
ggplot(plot_df) +
  geom_point(aes(x, y, size=dot)) +
  coord_equal() +
  theme_void() +
  ggtitle(this_word) +
  theme(legend.position = 'none') +
  expand_limits(y=c(-0.5, 2.5))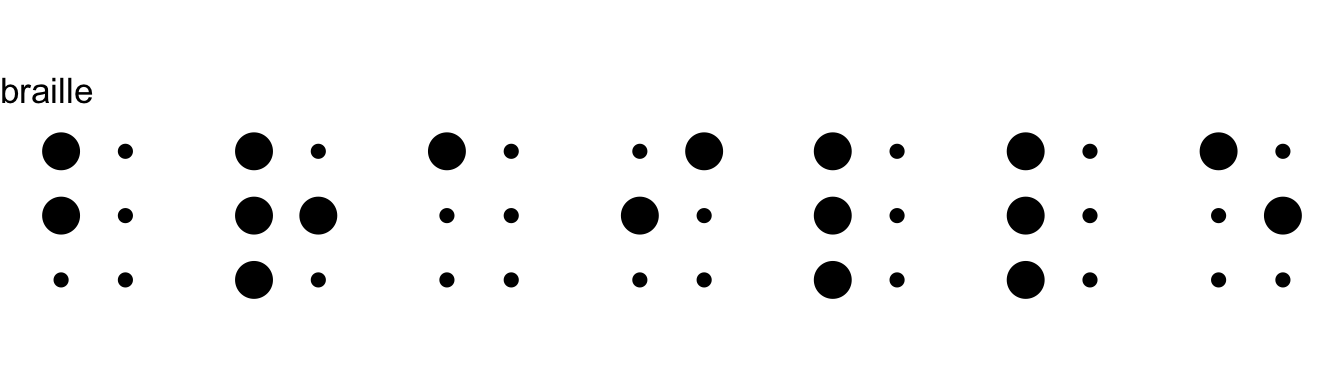
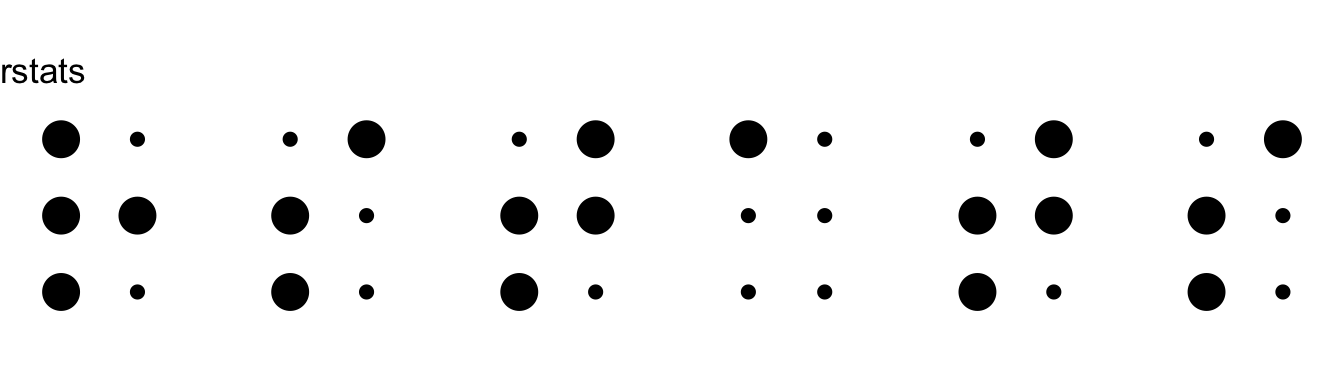
Tweetable Simple Braille Renderer (Grade 1)
#rstats
library(tidyverse)
d=c(1,5,3,11,9,7,15,13,6,14)
d=c(d,d+16,d+48,d+32)
L=setNames(c(1:22,40,23:25),letters)
D=map(d[L[strsplit('braille','')[[1]]]],~intToBits(.x)[1:6]>0)
P=data.frame(D=unlist(D),x=0:1+rep(seq(D),e=6)*3,y=rep(2:0,e=2))
ggplot(P)+geom_point(aes(x,y,size=D))
Warning: Using size for a discrete variable is not advised.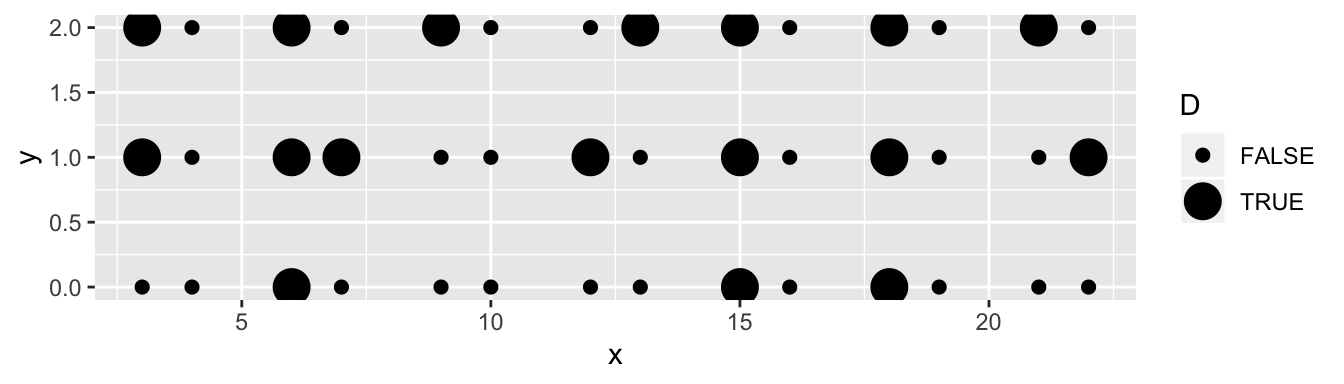
Idea (free to a good home)
- Translation of R plotmath expressions to Nemeth Braille