Nonograms
Nonograms are picture logic puzzles in which cells in a grid must be colored or left blank according to numbers at the side of the grid to reveal a hidden picture.
That is, the numbers on the side of the image (the clues) are the run-length encoding of the filled-in squares for each row and column.
By simultaneously satisfying the clues for the rows and columns, a picture is revealed!
![]()
In this short series of posts I will:
- Introduce the nonogram package (see yesterday’s post).
- Show how to make nonograms by hand, or from an existing image (today’s post).
- Describe the solution techniqe behind the package (future post).
The nonogram package
The nonogram package contains tools for plotting, solving and creating nonogram puzzles.
You can install nonogram from github with:
# install.packages("devtools")
devtools::install_github("coolbutuseless/nonogram")
Create your own puzzles
To make, print and solve your own nonograms, you just need to create a puzzle string.
The puzzle string format used to define puzzles is quite simple:
- the numbers for each clue are separated by a comma
- each clue is separated by a colon
- the clues for the rows come first, then a dash, then the clues for the columns
- row clues are read from left to right
- column clues are read from top to bottom
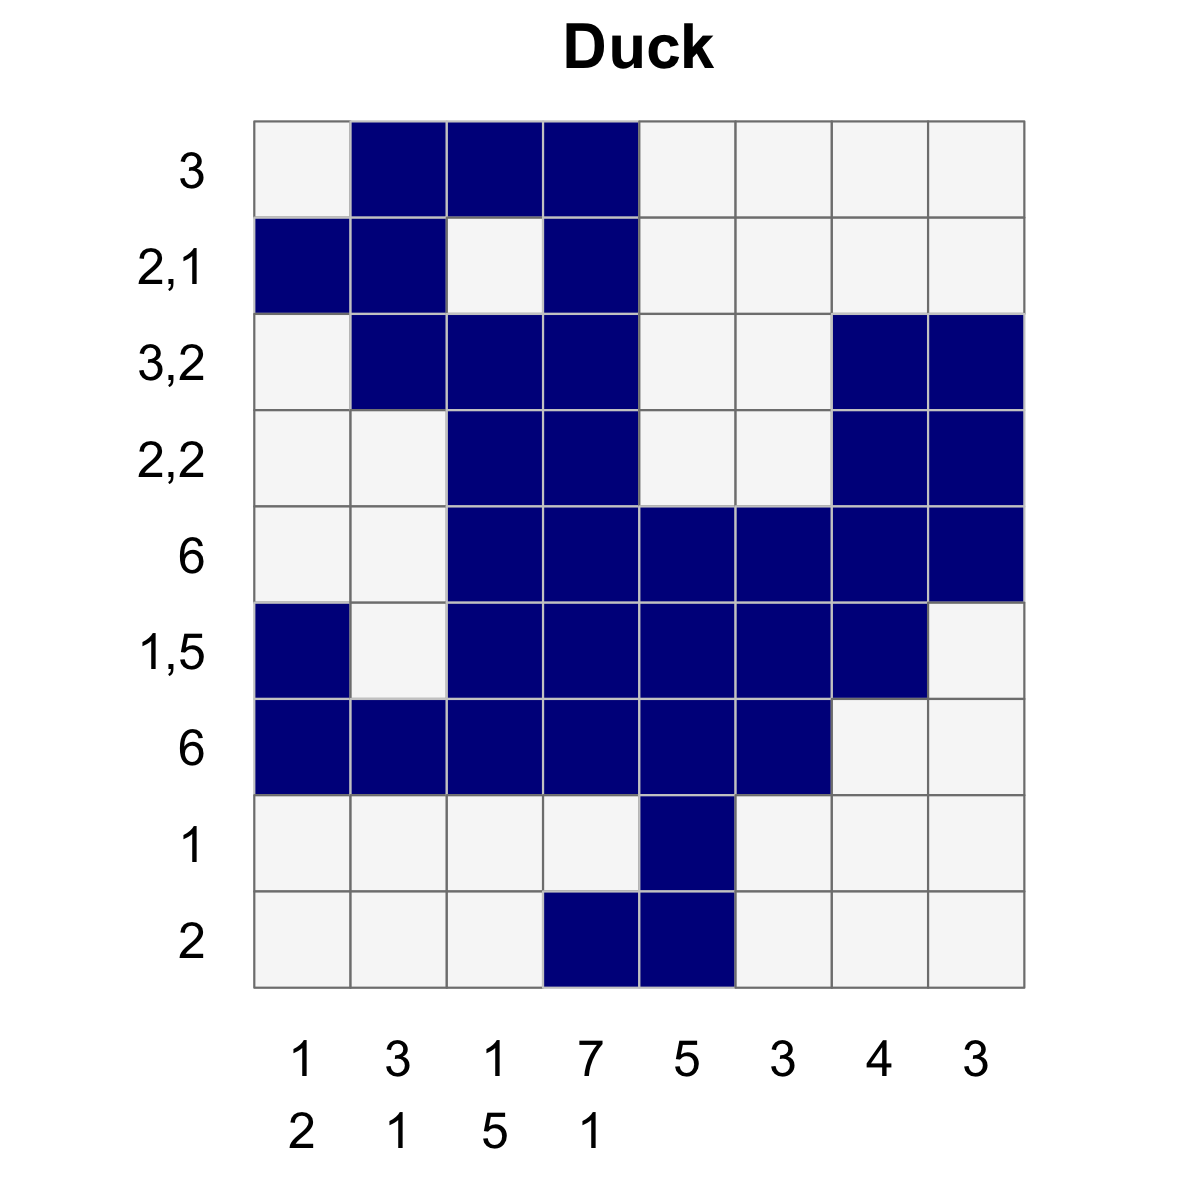
puzzle_string <- "3:1:1,1-3:1:1,1"
solution      <- solve_puzzle(puzzle_string)
create_puzzle_plot(puzzle_string, solution)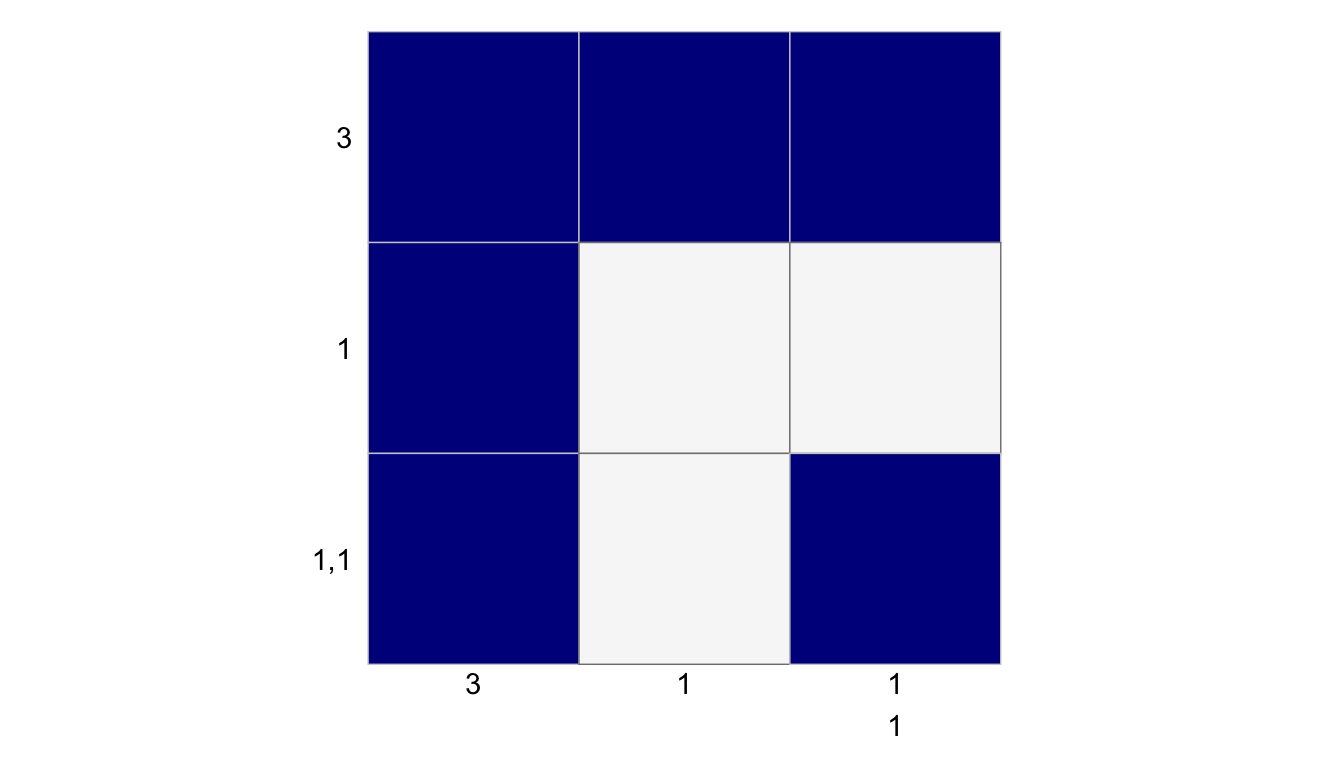
Create your own puzzles from an image using the magick package
Load an image with magick
- Load an image
- Make it grayscale
- Shrink it to nonogram size. e.g. 25x20
library(magick)
im <- magick::image_read(system.file("img", "Rlogo.jpg", package="jpeg"))
im
im <- im %>%
  image_quantize(max=2, colorspace = 'gray', dither=TRUE) %>%
image_scale(geometry = geometry_size_pixels(width=25, height=20, preserve_aspect=FALSE)) 
From the image, create an integer matrix with just zeros and ones
#~~~~~~~~~~~~~~~~~~~~~~~~~~~~~~~~~~~~~~~~~~~~~~~~~~~~~~~~~~~~~~~~~~~~~~~~~~~~~~
# Manipulating the image data to to matrix and then threshold, invert + tranpose
#~~~~~~~~~~~~~~~~~~~~~~~~~~~~~~~~~~~~~~~~~~~~~~~~~~~~~~~~~~~~~~~~~~~~~~~~~~~~~~
mat <- t(1L - 1L * (im[[1]][1,,] > 180))

#~~~~~~~~~~~~~~~~~~~~~~~~~~~~~~~~~~~~~~~~~~~~~~~~~~~~~~~~~~~~~~~~~~~~~~~~~~~~~~
# nonogram has a method for plotting a matrix in a standard way
#~~~~~~~~~~~~~~~~~~~~~~~~~~~~~~~~~~~~~~~~~~~~~~~~~~~~~~~~~~~~~~~~~~~~~~~~~~~~~~
nonogram::create_matrix_plot(mat)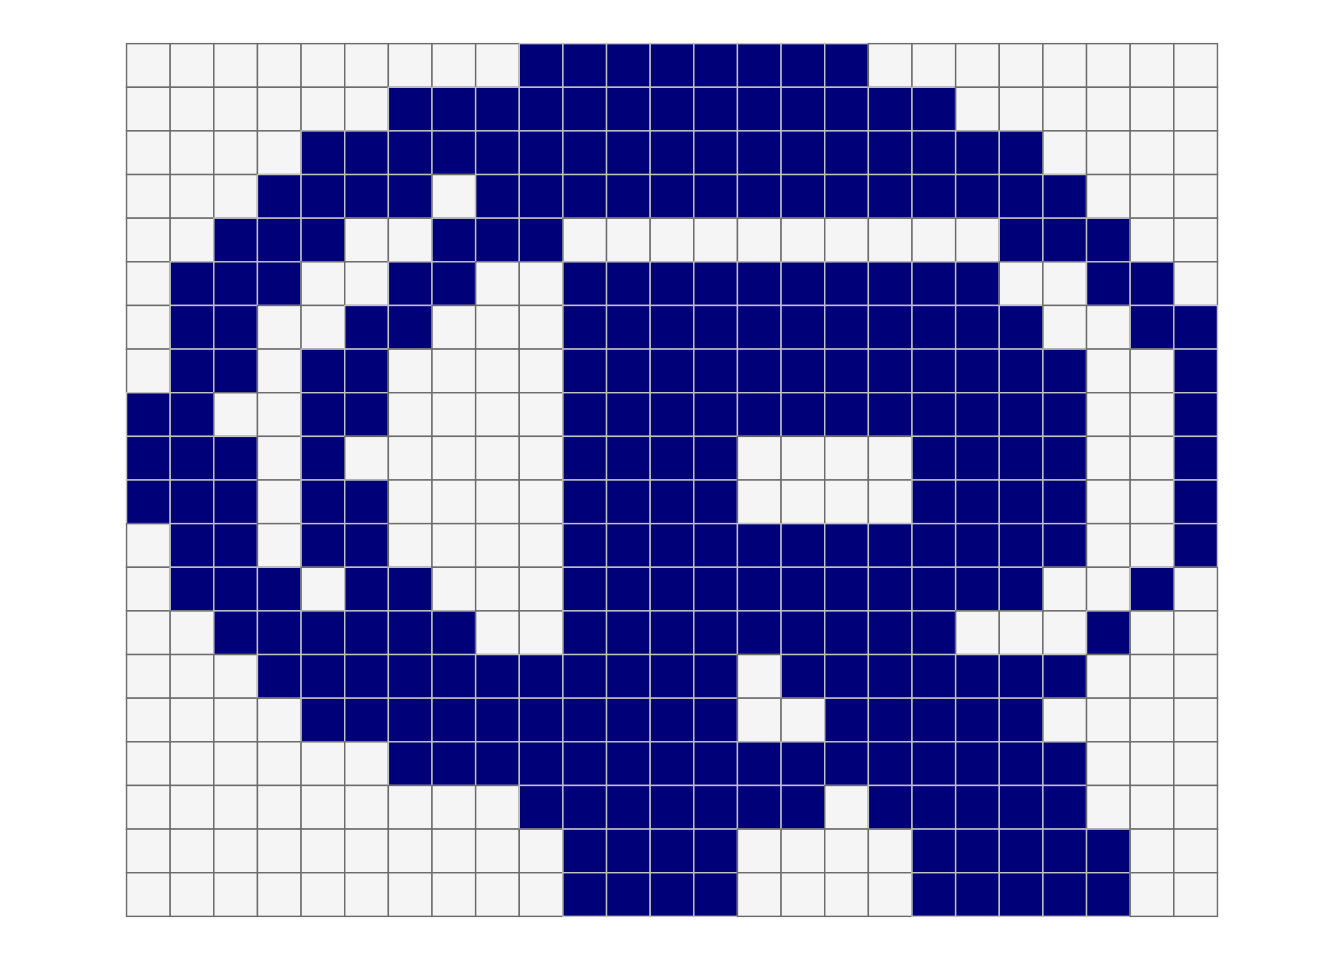
Create the puzzle from the matrix
puzzle        <- create_puzzle_from_matrix(mat)
puzzle_string <- convert_puzzle_to_puzzle_string(puzzle)
> puzzlelist(row_clues = list(8L, 13L, 17L, c(4L, 14L), c(3L, 3L, 3L),
c(3L, 2L, 10L, 2L), c(2L, 2L, 11L, 2L), c(2L, 2L, 12L, 1L
), c(2L, 2L, 12L, 1L), c(3L, 1L, 4L, 4L, 1L), c(3L, 2L, 4L,
4L, 1L), c(2L, 2L, 12L, 1L), c(3L, 2L, 11L, 1L), c(6L, 9L,
1L), c(11L, 7L), c(10L, 5L), 16L, c(7L, 5L), 4:5, 4:5), col_clues = list(
3L, 8L, 4:5, c(3L, 3L), c(3L, 5L, 3L), c(2L, 3L, 6L), c(3L,
2L, 5L), c(2L, 2L, 4L), 4:3, 5:4, c(4L, 15L), c(4L, 15L),
c(4L, 15L), c(4L, 15L), c(4L, 4L, 3L, 2L), c(4L, 4L, 4L,
2L), c(4L, 4L, 6L), c(3L, 4L, 7L), c(3L, 15L), c(2L, 8L,
6L), c(3L, 7L, 6L), c(2L, 5L, 1L, 4L), c(2L, 1L, 2L), 2:1,
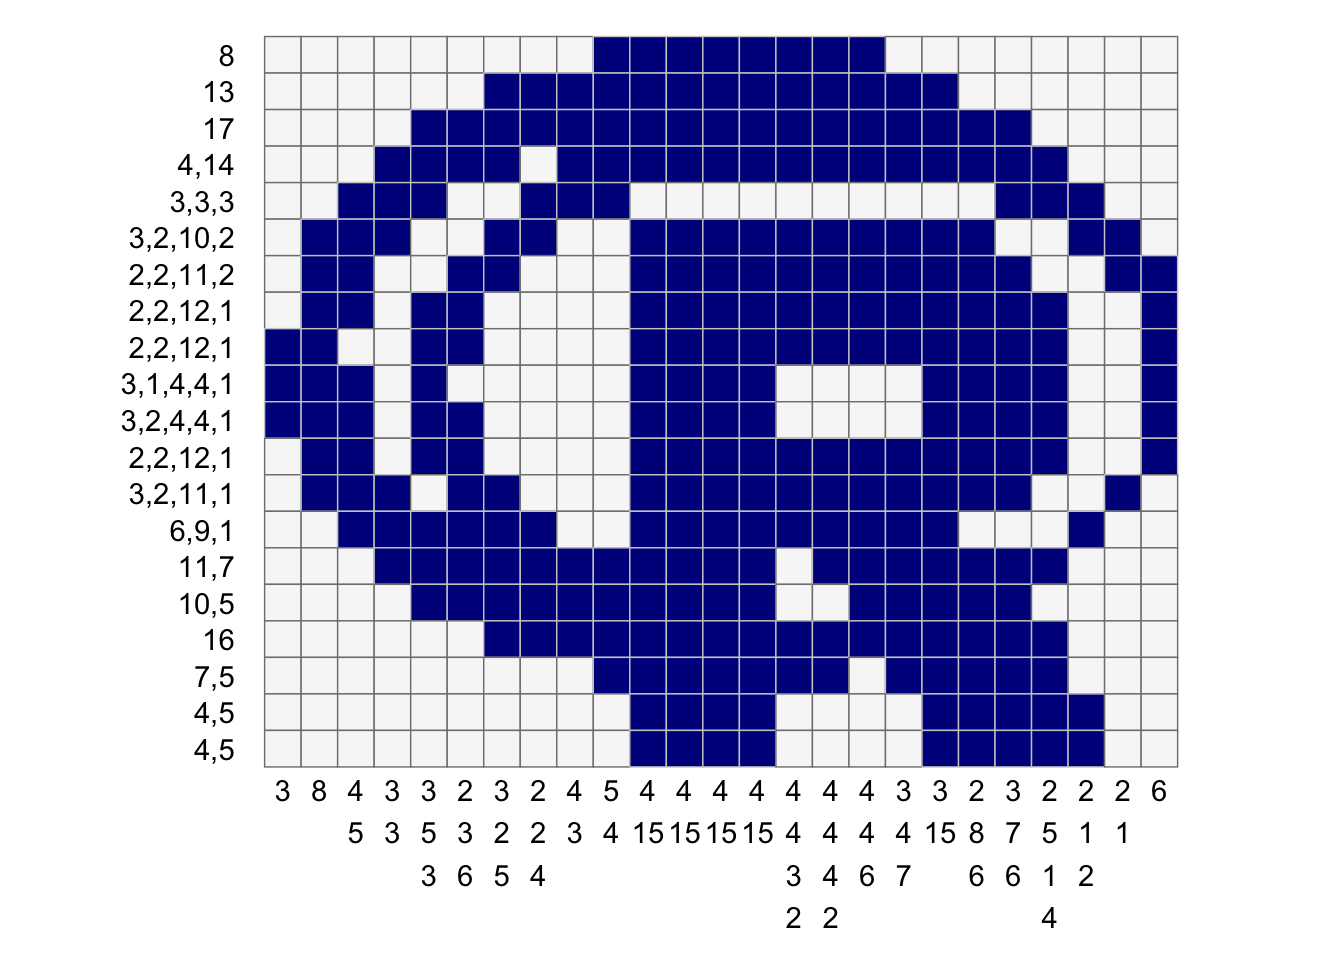
6L))> puzzle_string8:13:17:4,14:3,3,3:3,2,10,2:2,2,11,2:2,2,12,1:2,2,12,1:3,1,4,4,1:3,2,4,4,1:2,2,12,1:3,2,11,1:6,9,1:11,7:10,5:16:7,5:4,5:4,5-3:8:4,5:3,3:3,5,3:2,3,6:3,2,5:2,2,4:4,3:5,4:4,15:4,15:4,15:4,15:4,4,3,2:4,4,4,2:4,4,6:3,4,7:3,15:2,8,6:3,7,6:2,5,1,4:2,1,2:2,1:6Create a blank plot of just the clues
create_puzzle_plot(puzzle, show_clues=TRUE)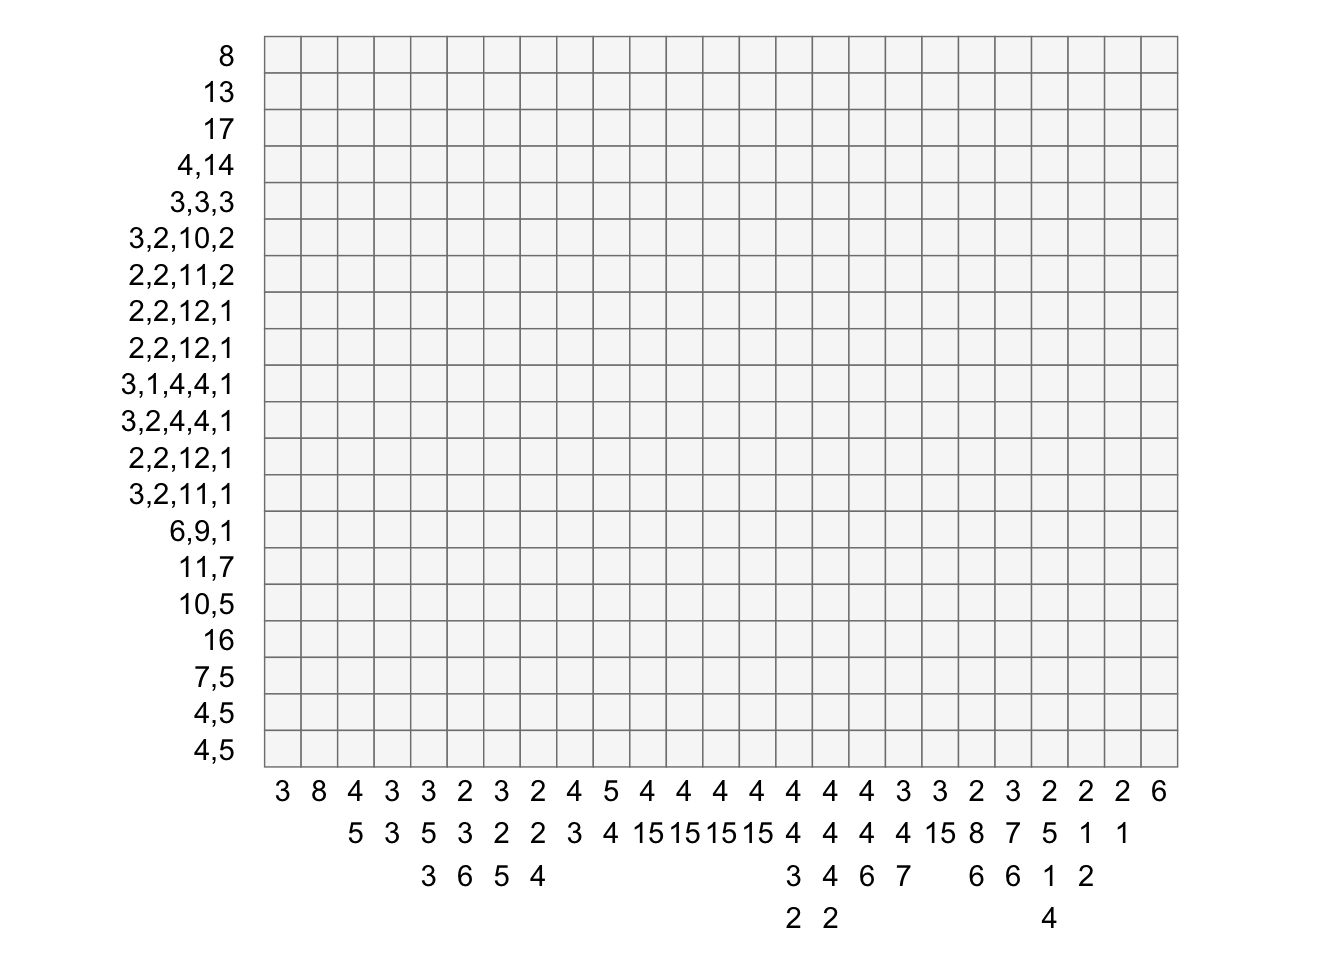
Create a plot of the matrix and clues
create_puzzle_plot(puzzle, mat, show_clues=TRUE)