Should I write a geom for 3d pie charts?
Introducing the ggthreed package
ggthreed is a collection of ggplot2
geoms which use the threed library.
At present it consists of just a single geom: geom_threedpie() which creates
3d pie charts.
I am fully aware of the crimes against visualisation I am committing here.
The code is available on github.
Installation
You can install from github
install.packages("coolbutuseless/threed")
install.packages("coolbutuseless/ggthreed")
Example - Simple Pie Chart
ggplot(mtcars) +
  geom_threedpie(aes(x = as.factor(cyl))) +
  theme_void() +
  theme(legend.position = 'bottom')
Warning: Unknown or uninitialised column: 'subgroup'.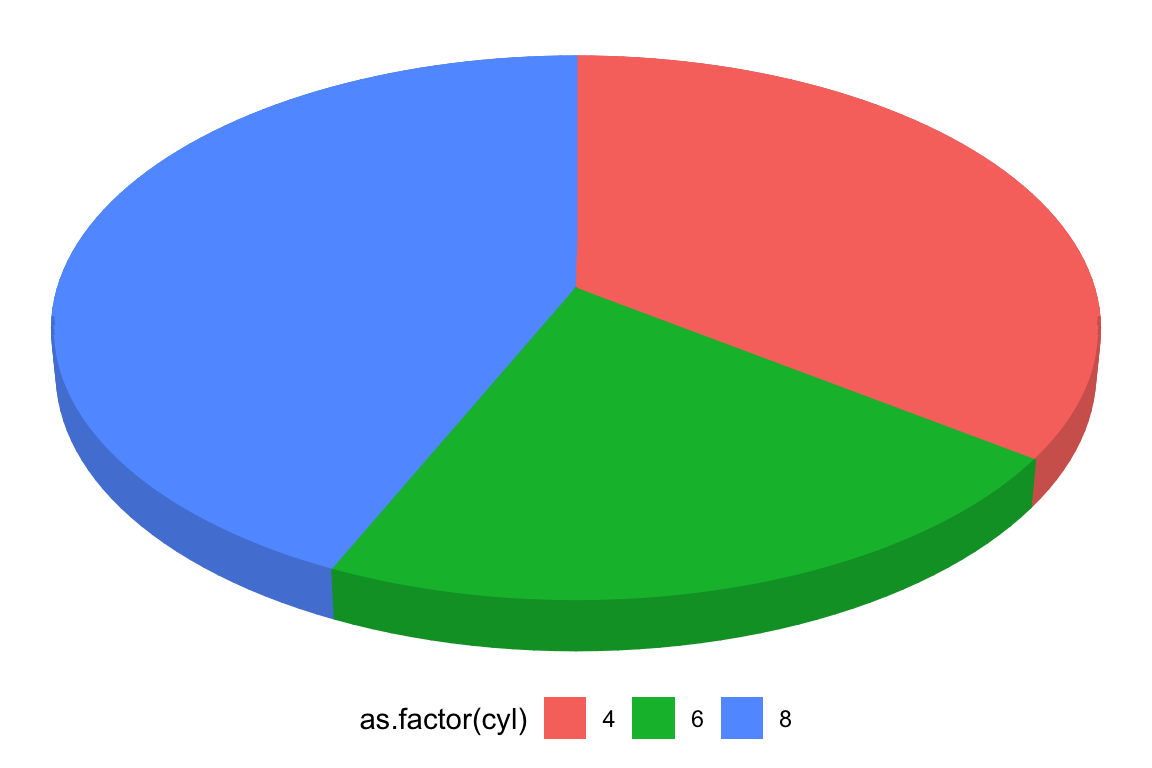
Example - Facetted Pie Chart
ggplot(diamonds)  +
  geom_threedpie(aes(as.factor(cut))) +
  facet_wrap(~clarity, labeller = label_both) +
  labs(title = "Distribution of Diamond Cuts by Clarity") +
  scale_fill_brewer(name = "Cut", palette = 'Set2') +
  theme_void()
Warning: Unknown or uninitialised column: 'subgroup'.

Warning: Unknown or uninitialised column: 'subgroup'.

Warning: Unknown or uninitialised column: 'subgroup'.

Warning: Unknown or uninitialised column: 'subgroup'.

Warning: Unknown or uninitialised column: 'subgroup'.

Warning: Unknown or uninitialised column: 'subgroup'.

Warning: Unknown or uninitialised column: 'subgroup'.

Warning: Unknown or uninitialised column: 'subgroup'.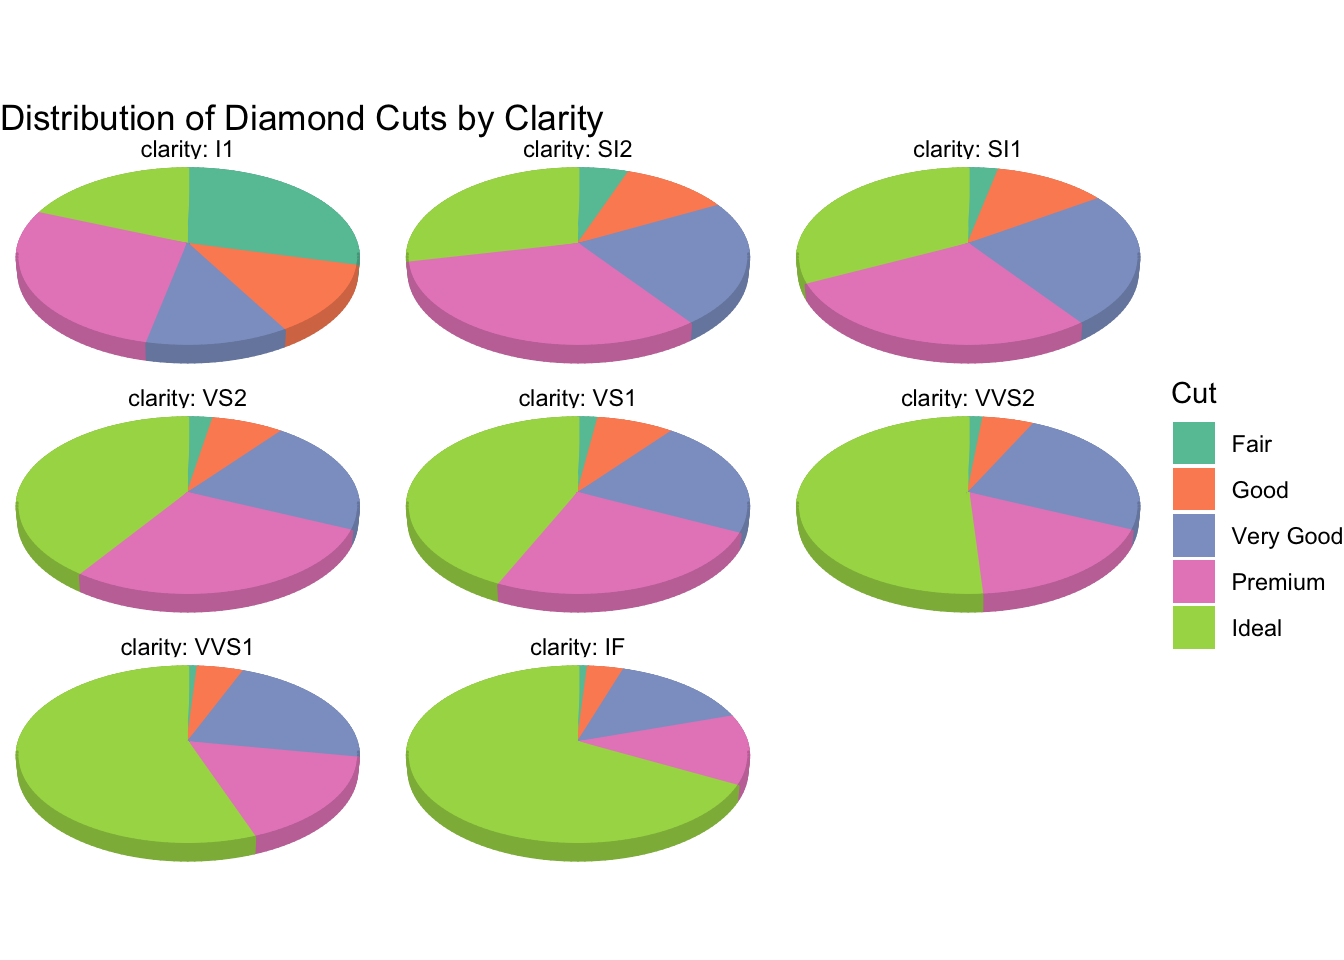
Example - Pie appearance
User adjustable:
- pie height
- pie tilt
- start of first pie slice