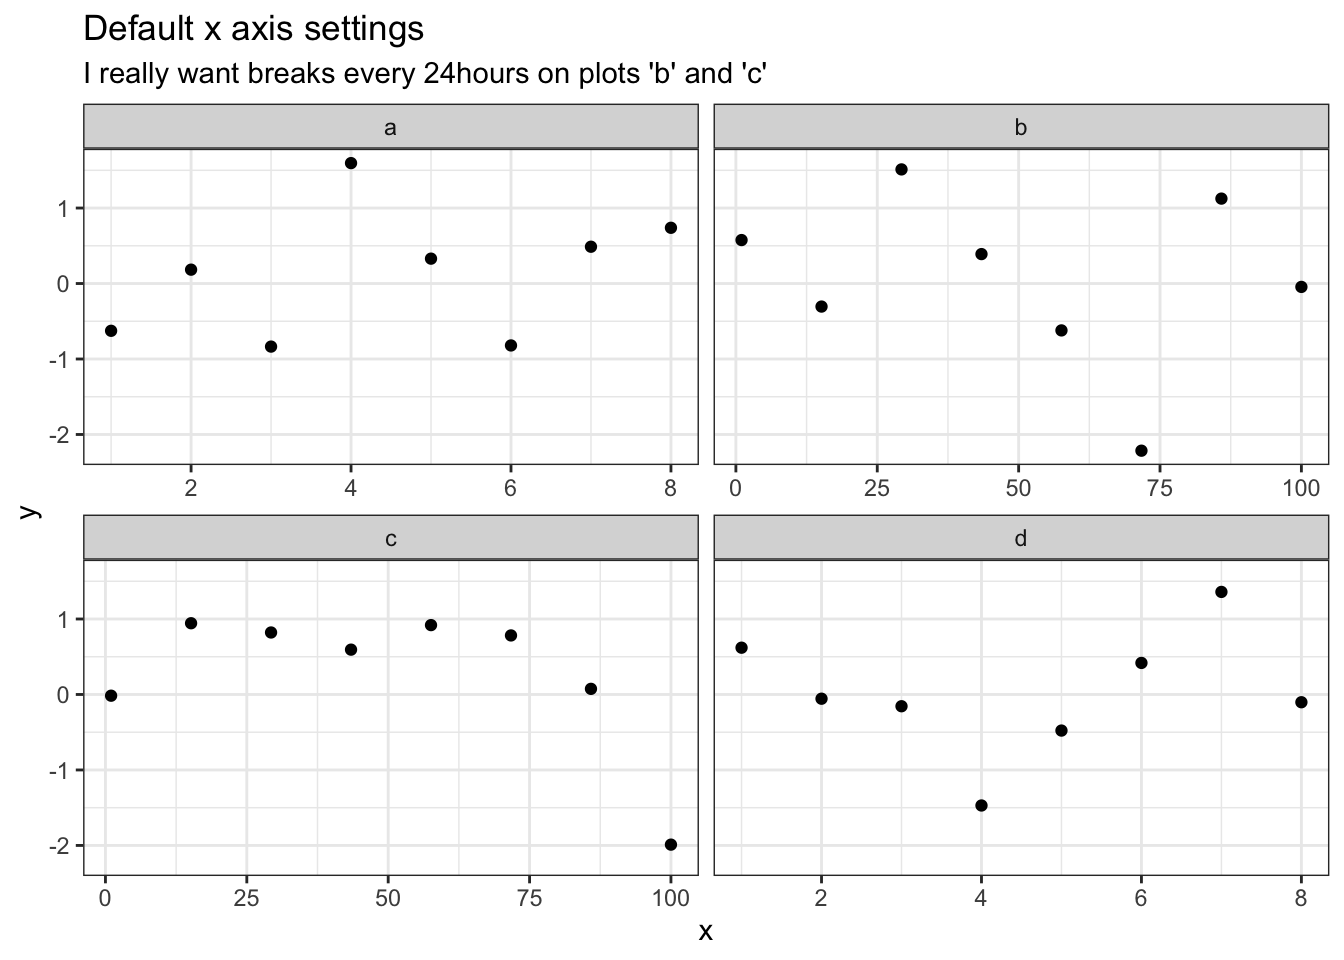
I needed to create a facetted ggplot with custom x-axis breaks on every single plot.
The x-axis had units of hours and some plots spanned multiple days, and other spanned just a few hours. For the facets that spanned multiple days I wanted breaks at every 24 hours, but for the shorter times I needed breaks every hour.
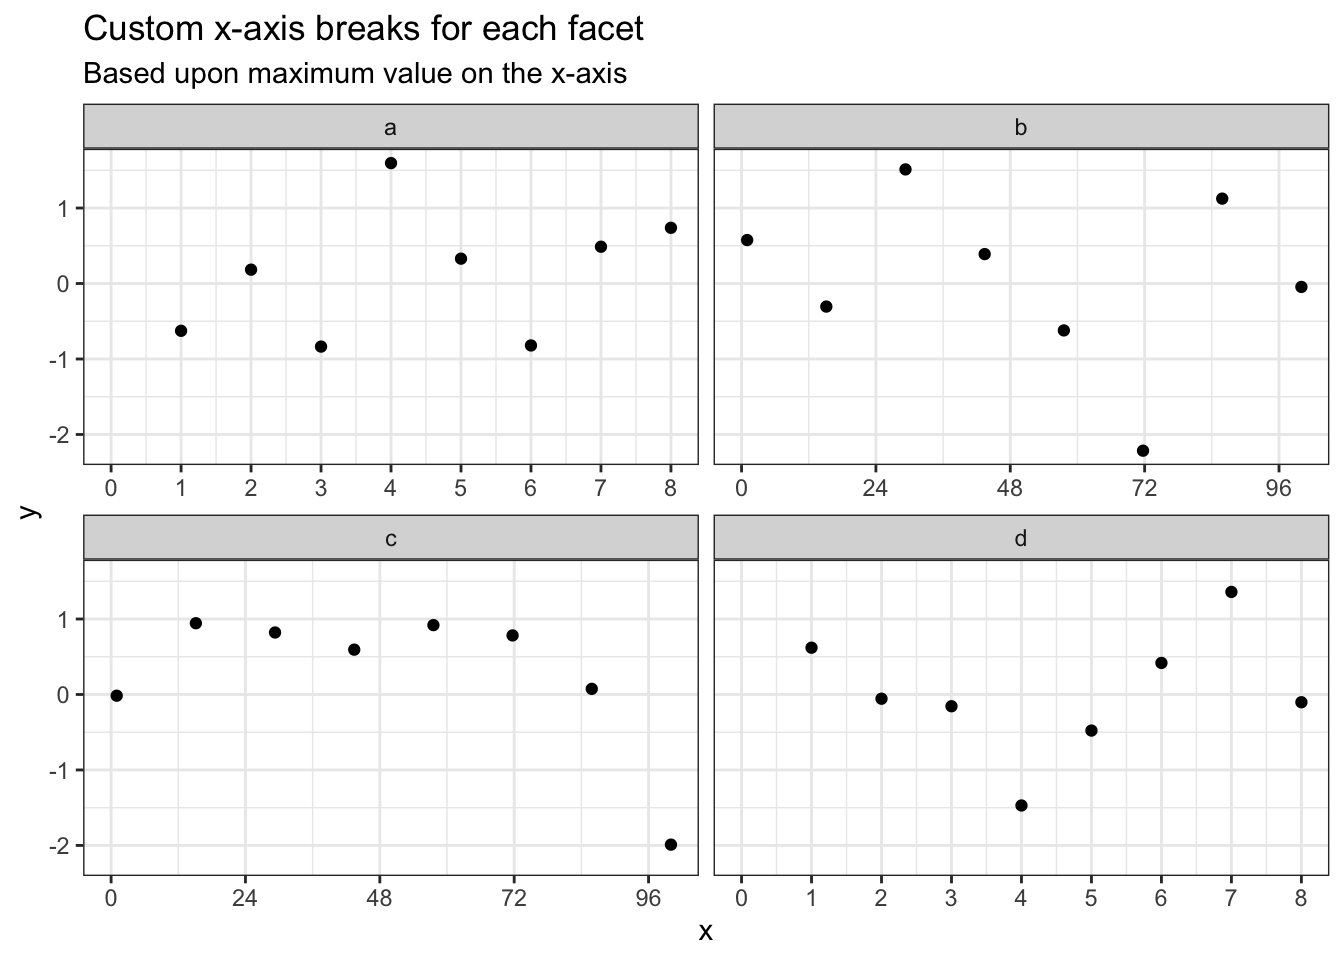
ggplot2 allows you to use a function to set the breaks for
the x-axis, so I could just check what the limits of the plot are and do
two different things depending on the upper limit.
breaks_fun <- function(x) {
  if (max(x) > 24) {
    seq(0, 120, 24)
  } else {
    seq(0, 8, 1)
  }
}

ggplot(df) +
  geom_point(aes(x, y)) +
  facet_wrap(~id, scales = 'free_x') +
  theme_bw() +
  scale_x_continuous(breaks = breaks_fun, limits = c(0, NA)) +
  labs(
    title = "Custom x-axis breaks for each facet",
    subtitle = "Based upon maximum value on the x-axis"
  )
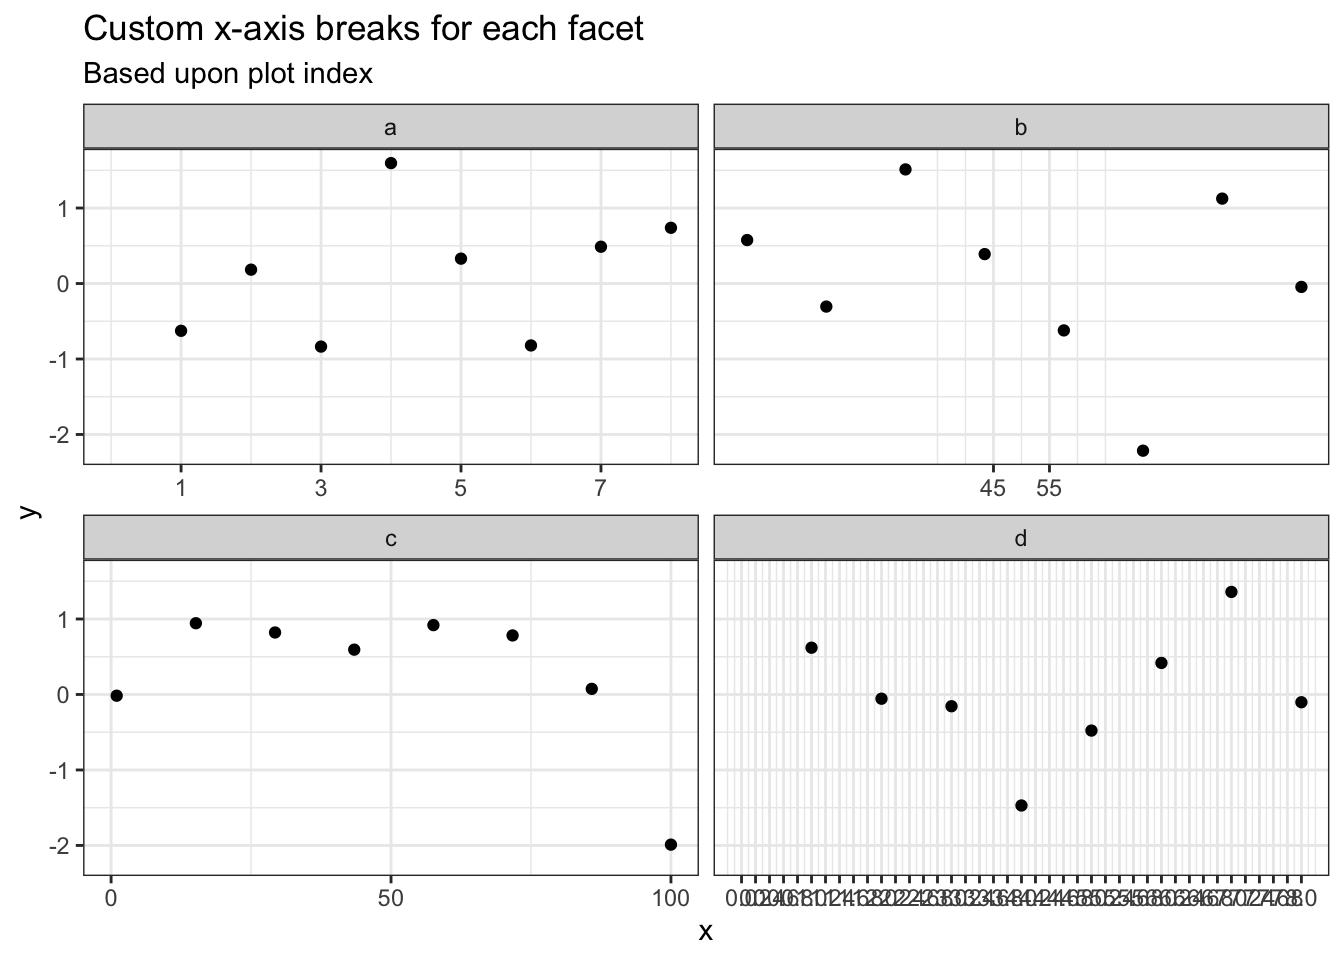
And then I could use a global variable to keep track of which plot is being addressed and customise x-axis breaks even further.
count <- 0
breaks_fun <- function(x) {
  count <<- count + 1L
  switch(
    count,
    c(1, 3, 5, 7, 9),
    c(45, 55),
    c(0, 50, 100),
    seq(0, 8, 0.2)
  )
}

ggplot(df) +
  geom_point(aes(x, y)) +
  facet_wrap(~id, scales = 'free_x') +
  theme_bw() +
  scale_x_continuous(breaks = breaks_fun, limits = c(0, NA)) +
  labs(
    title = "Custom x-axis breaks for each facet",
    subtitle = "Based upon plot index"
  )