ggdebug
![]()
ggdebug is a package for debugging ggplot2 stats.
I created this package to help in developing new ggplot2 stats, and trying
to decipher and understand how existing ones work.
What’s in the box:
create_stat_with_caching()- Capture arguments and the return values internal to Stat methods
inject_data_into_stat_function()- Inject arguments and return values directly into Stat methods
This package wouldn’t be possible without:
- ggplot2 by Hadley Wickham
- Brodie Gaslam’s great guide to ggplot2 internals
- boBRudis’s post on demystifying ggplot2
Installation
You can install the development version from GitHub with:
# install.packages("remotes")
remotes::install_github("coolbutuseless/ggdebug")
Debug geom_histogram + StatBin
The following example shows how ggdebug can be used to capture the data during
creation of geom_histogram().
geom_histogram() uses a default Stat of StatBin. Instead we create a
debugging version of this Stat and use it explicitly.
The captured data is available by calling
ggdebug::get_cache_data().
#~~~~~~~~~~~~~~~~~~~~~~~~~~~~~~~~~~~~~~~~~~~~~~~~~~~~~~~~~~~~~~~~~~~~~~~~~~~~~~
# Create a new stat which is identical to StatBin, but captures the
# data for all the methods.
#~~~~~~~~~~~~~~~~~~~~~~~~~~~~~~~~~~~~~~~~~~~~~~~~~~~~~~~~~~~~~~~~~~~~~~~~~~~~~~
StatBinDebug <- ggdebug::create_stat_with_caching(
  StatBin
)
#~~~~~~~~~~~~~~~~~~~~~~~~~~~~~~~~~~~~~~~~~~~~~~~~~~~~~~~~~~~~~~~~~~~~~~~~~~~~~~
# Create the plot using the new Stat
#~~~~~~~~~~~~~~~~~~~~~~~~~~~~~~~~~~~~~~~~~~~~~~~~~~~~~~~~~~~~~~~~~~~~~~~~~~~~~~
ggplot(mtcars) +
geom_histogram(aes(mpg, fill = as.factor(cyl)), stat = StatBinDebug, bins = 10) +
theme_bw() +
facet_wrap(~cyl)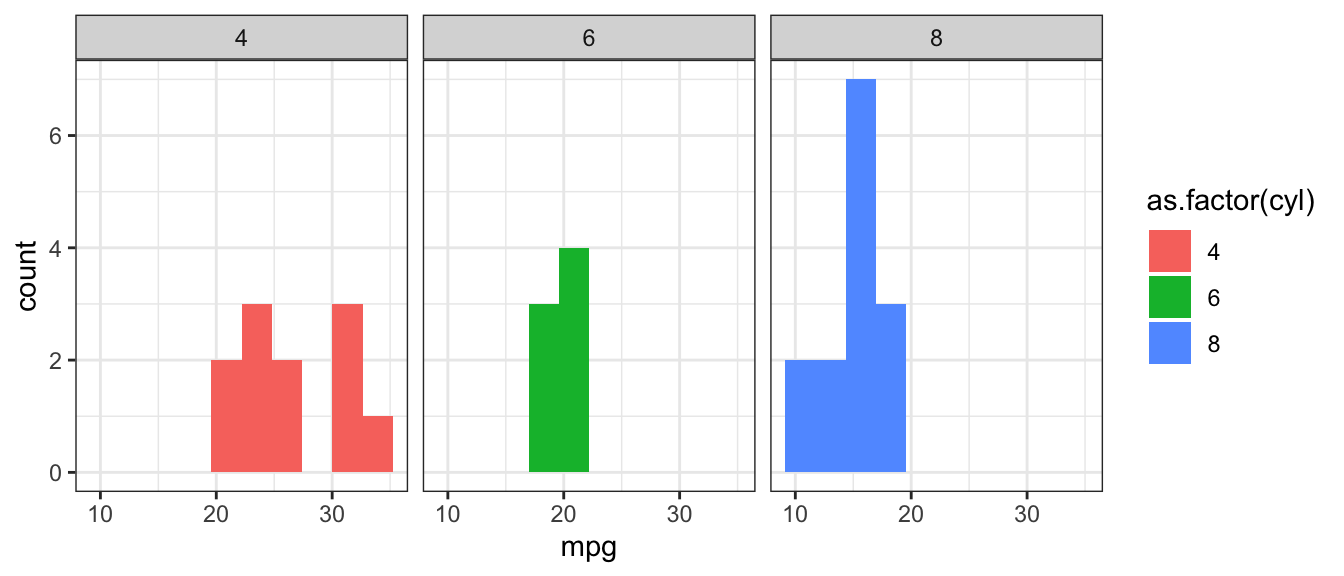
#~~~~~~~~~~~~~~~~~~~~~~~~~~~~~~~~~~~~~~~~~~~~~~~~~~~~~~~~~~~~~~~~~~~~~~~~~~~~~~
# Get the data we captured from this process
#~~~~~~~~~~~~~~~~~~~~~~~~~~~~~~~~~~~~~~~~~~~~~~~~~~~~~~~~~~~~~~~~~~~~~~~~~~~~~~
cdata <- ggdebug::get_data_cache()

#~~~~~~~~~~~~~~~~~~~~~~~~~~~~~~~~~~~~~~~~~~~~~~~~~~~~~~~~~~~~~~~~~~~~~~~~~~~~~~
# Interrogate the captured data.
# Each method has its only entry in the data cache, and
# within each entry there are both the `args` and the `return` value
# for this method
#~~~~~~~~~~~~~~~~~~~~~~~~~~~~~~~~~~~~~~~~~~~~~~~~~~~~~~~~~~~~~~~~~~~~~~~~~~~~~~
names(cdata)
[1] "parameters"    "compute_group" "compute_panel" "compute_layer"
[5] "finish_layer"

#~~~~~~~~~~~~~~~~~~~~~~~~~~~~~~~~~~~~~~~~~~~~~~~~~~~~~~~~~~~~~~~~~~~~~~~~~~~~~~
# arguments and the return value for the 'parameters()' method
#~~~~~~~~~~~~~~~~~~~~~~~~~~~~~~~~~~~~~~~~~~~~~~~~~~~~~~~~~~~~~~~~~~~~~~~~~~~~~~
cdata$parameters
$args
$args$extra
[1] FALSE


$return
 [1] "binwidth" "bins"     "center"   "boundary" "closed"   "pad"
 [7] "breaks"   "origin"   "right"    "drop"     "width"

#~~~~~~~~~~~~~~~~~~~~~~~~~~~~~~~~~~~~~~~~~~~~~~~~~~~~~~~~~~~~~~~~~~~~~~~~~~~~~~
# The 'data' argument passed in to the 'compute_layer()' method
#~~~~~~~~~~~~~~~~~~~~~~~~~~~~~~~~~~~~~~~~~~~~~~~~~~~~~~~~~~~~~~~~~~~~~~~~~~~~~~
head(cdata$compute_layer$args$data)
     x fill PANEL group
1 21.0    6     2     2
2 21.0    6     2     2
3 22.8    4     1     1
4 21.4    6     2     2
5 18.7    8     3     3
6 18.1    6     2     2

#~~~~~~~~~~~~~~~~~~~~~~~~~~~~~~~~~~~~~~~~~~~~~~~~~~~~~~~~~~~~~~~~~~~~~~~~~~~~~~
# The return value from the 'finish_layer()' method
#~~~~~~~~~~~~~~~~~~~~~~~~~~~~~~~~~~~~~~~~~~~~~~~~~~~~~~~~~~~~~~~~~~~~~~~~~~~~~~
head(cdata$finish_layer$return)
     fill y count        x      xmin     xmax   density    ncount  ndensity
1 #F8766D 0     0 10.44444  9.138889 11.75000 0.0000000 0.0000000 0.0000000
2 #F8766D 0     0 13.05556 11.750000 14.36111 0.0000000 0.0000000 0.0000000
3 #F8766D 0     0 15.66667 14.361111 16.97222 0.0000000 0.0000000 0.0000000
4 #F8766D 0     0 18.27778 16.972222 19.58333 0.0000000 0.0000000 0.0000000
5 #F8766D 2     2 20.88889 19.583333 22.19444 0.0696325 0.6666667 0.6666667
6 #F8766D 3     3 23.50000 22.194444 24.80556 0.1044487 1.0000000 1.0000000
  PANEL group ymin ymax colour size linetype alpha
1     1     1    0    0     NA  0.5        1    NA
2     1     1    0    0     NA  0.5        1    NA
3     1     1    0    0     NA  0.5        1    NA
4     1     1    0    0     NA  0.5        1    NA
5     1     1    0    2     NA  0.5        1    NA
6     1     1    0    3     NA  0.5        1    NA
Inject data into geom_histogram + StatBin
ggdebug also allows you to inject arguments and override return values within
methods inside a Stat.
In this example, we take the above histogram, and at the last stage (finish_layer)
we inject a modified return value to override the real one.
#~~~~~~~~~~~~~~~~~~~~~~~~~~~~~~~~~~~~~~~~~~~~~~~~~~~~~~~~~~~~~~~~~~~~~~~~~~~~~~
# From the above debugging example, grab the return value from `finish_layer`
#~~~~~~~~~~~~~~~~~~~~~~~~~~~~~~~~~~~~~~~~~~~~~~~~~~~~~~~~~~~~~~~~~~~~~~~~~~~~~~
finish_layer_return_value <- cdata$finish_layer$return

#~~~~~~~~~~~~~~~~~~~~~~~~~~~~~~~~~~~~~~~~~~~~~~~~~~~~~~~~~~~~~~~~~~~~~~~~~~~~~~
# Change the visual properties for the bar with the greatest height
#~~~~~~~~~~~~~~~~~~~~~~~~~~~~~~~~~~~~~~~~~~~~~~~~~~~~~~~~~~~~~~~~~~~~~~~~~~~~~~
finish_layer_return_value <- finish_layer_return_value %>%
  group_by(group) %>%
  mutate(
    fill   = ifelse(count == max(count), '#000000', fill  ),
    colour = ifelse(count == max(count), '#ff0000', colour),
    size   = ifelse(count == max(count), 1        , size  )
  ) %>%
  ungroup()

#~~~~~~~~~~~~~~~~~~~~~~~~~~~~~~~~~~~~~~~~~~~~~~~~~~~~~~~~~~~~~~~~~~~~~~~~~~~~~~
# Create a modified version of StatBin which only returns our version of the
# dataset from `finishlayer`
#~~~~~~~~~~~~~~~~~~~~~~~~~~~~~~~~~~~~~~~~~~~~~~~~~~~~~~~~~~~~~~~~~~~~~~~~~~~~~~
StatBinInject <- inject_data_into_stat_function(
  StatBin, 'finish_layer',
  return_value = finish_layer_return_value
)

#~~~~~~~~~~~~~~~~~~~~~~~~~~~~~~~~~~~~~~~~~~~~~~~~~~~~~~~~~~~~~~~~~~~~~~~~~~~~~~
# Recreate the plot using the injected data as the return from `finish_layer`
#~~~~~~~~~~~~~~~~~~~~~~~~~~~~~~~~~~~~~~~~~~~~~~~~~~~~~~~~~~~~~~~~~~~~~~~~~~~~~~
ggplot(mtcars) +
  geom_histogram(aes(mpg, fill = as.factor(cyl)), stat = StatBinInject, bins = 5) +
  theme_bw() +
  facet_wrap(~cyl) +
  labs(title = "Use injected data to highlight the maximum bar within each group")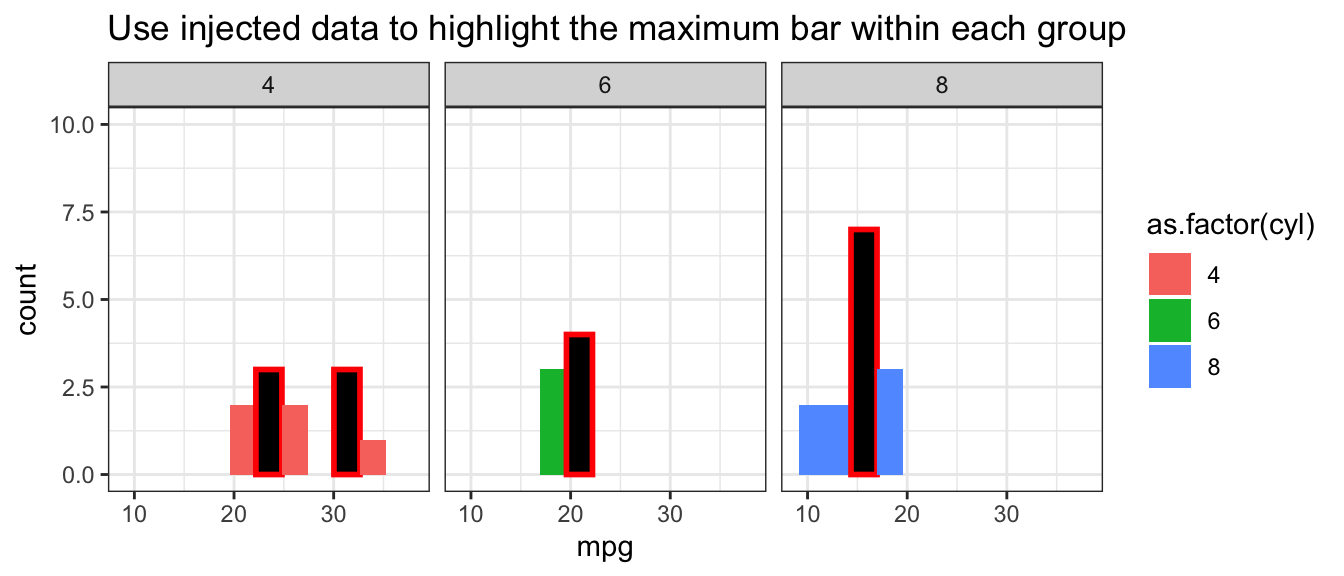
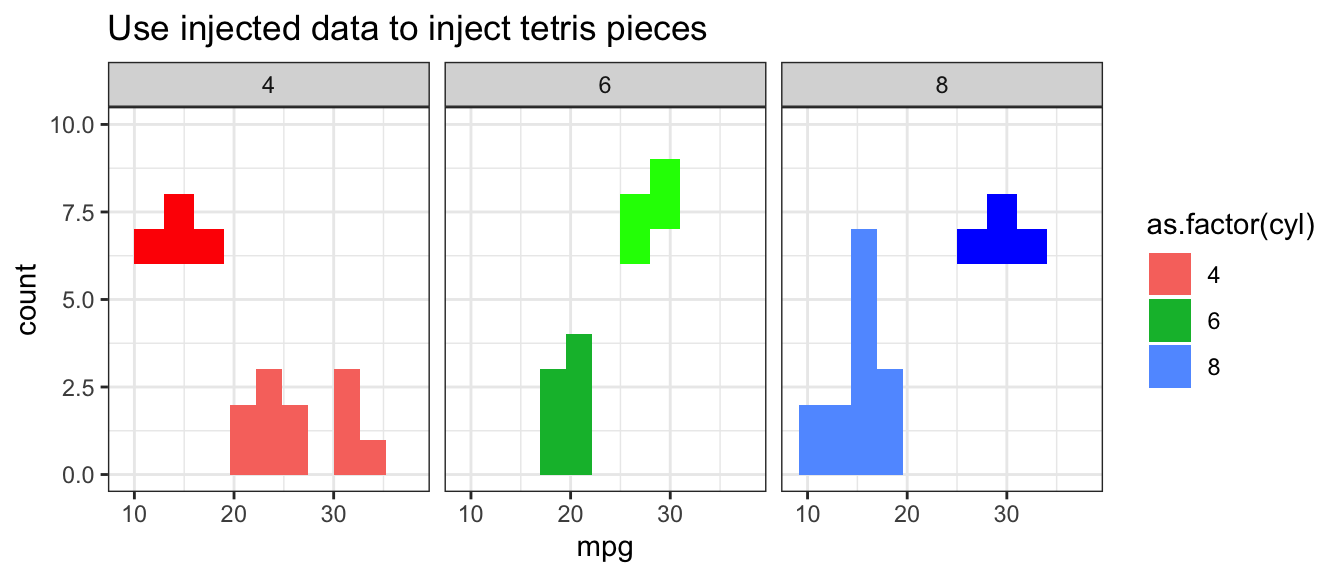
Inject tetris pieces into geom_histogram + StatBin
#~~~~~~~~~~~~~~~~~~~~~~~~~~~~~~~~~~~~~~~~~~~~~~~~~~~~~~~~~~~~~~~~~~~~~~~~~~~~~~
# Create 3 tetris pieces
#~~~~~~~~~~~~~~~~~~~~~~~~~~~~~~~~~~~~~~~~~~~~~~~~~~~~~~~~~~~~~~~~~~~~~~~~~~~~~~
tetris <- tribble(
  ~fill    , ~xmin, ~xmax, ~ymin, ~ymax,
  '#ff0000', 10, 19, 6, 7,
  '#ff0000', 13, 16, 6, 8,
  '#00ff00', 25, 28, 6, 8,
  '#00ff00', 28, 31, 7, 9,
  '#0000ff', 25, 34, 6, 7,
  '#0000ff', 28, 31, 6, 8
)

#~~~~~~~~~~~~~~~~~~~~~~~~~~~~~~~~~~~~~~~~~~~~~~~~~~~~~~~~~~~~~~~~~~~~~~~~~~~~~~
# Assign each piece to a different panel
#~~~~~~~~~~~~~~~~~~~~~~~~~~~~~~~~~~~~~~~~~~~~~~~~~~~~~~~~~~~~~~~~~~~~~~~~~~~~~~
tetris <- tetris %>% mutate(
  PANEL    = factor(c(1, 1, 2, 2, 3, 3), levels = 1:3),
  group    = 1,
  linetype = 1,
  x        = xmax,
  y        = ymax
)

#~~~~~~~~~~~~~~~~~~~~~~~~~~~~~~~~~~~~~~~~~~~~~~~~~~~~~~~~~~~~~~~~~~~~~~~~~~~~~~
# Add the tetris data to the original data returned by `finish_layer`
#~~~~~~~~~~~~~~~~~~~~~~~~~~~~~~~~~~~~~~~~~~~~~~~~~~~~~~~~~~~~~~~~~~~~~~~~~~~~~~
finish_layer_return_value <- bind_rows(
  tetris,
  cdata$finish_layer$return
)

#~~~~~~~~~~~~~~~~~~~~~~~~~~~~~~~~~~~~~~~~~~~~~~~~~~~~~~~~~~~~~~~~~~~~~~~~~~~~~~
# Create a StatBin that only returns this modified data from `finish_layer`
#~~~~~~~~~~~~~~~~~~~~~~~~~~~~~~~~~~~~~~~~~~~~~~~~~~~~~~~~~~~~~~~~~~~~~~~~~~~~~~
StatBinInject <- inject_data_into_stat_function(
  StatBin, 'finish_layer',
  return_value = finish_layer_return_value
)

#~~~~~~~~~~~~~~~~~~~~~~~~~~~~~~~~~~~~~~~~~~~~~~~~~~~~~~~~~~~~~~~~~~~~~~~~~~~~~~
# Create the plot to generate tetris pieces injected into the data
#~~~~~~~~~~~~~~~~~~~~~~~~~~~~~~~~~~~~~~~~~~~~~~~~~~~~~~~~~~~~~~~~~~~~~~~~~~~~~~
ggplot(mtcars) +
  geom_histogram(aes(mpg, fill = as.factor(cyl)), stat = StatBinInject, bins = 5) +
  theme_bw() +
  facet_wrap(~cyl) +
  labs(title = "Use injected data to inject tetris pieces")