Question: Is it possible to generate every possible scatterplot from a data.frame?
Is it?
Answer: Yes
- Yes, is is possible to generate every possible scatterplot from a data.frame.
- Even on limited subset of aesthetics, there are still 32 thousand possible scatterplots.
- Code included below
- Constraints:
- Not mapping
alpha,fill,strokeorgroup - Each variable could be used in only one aesthetic mapping on a
single plot e.g. a variable couldn’t
be mapped to both
shapeandcoloursimultaneously.
- Not mapping
- Challenges:
- Keeping the combinational explosion to a minimum - wrote a recursive function for assigning variables to aesthetics
- Allowing optional aesthetics to not be mapped to a variable
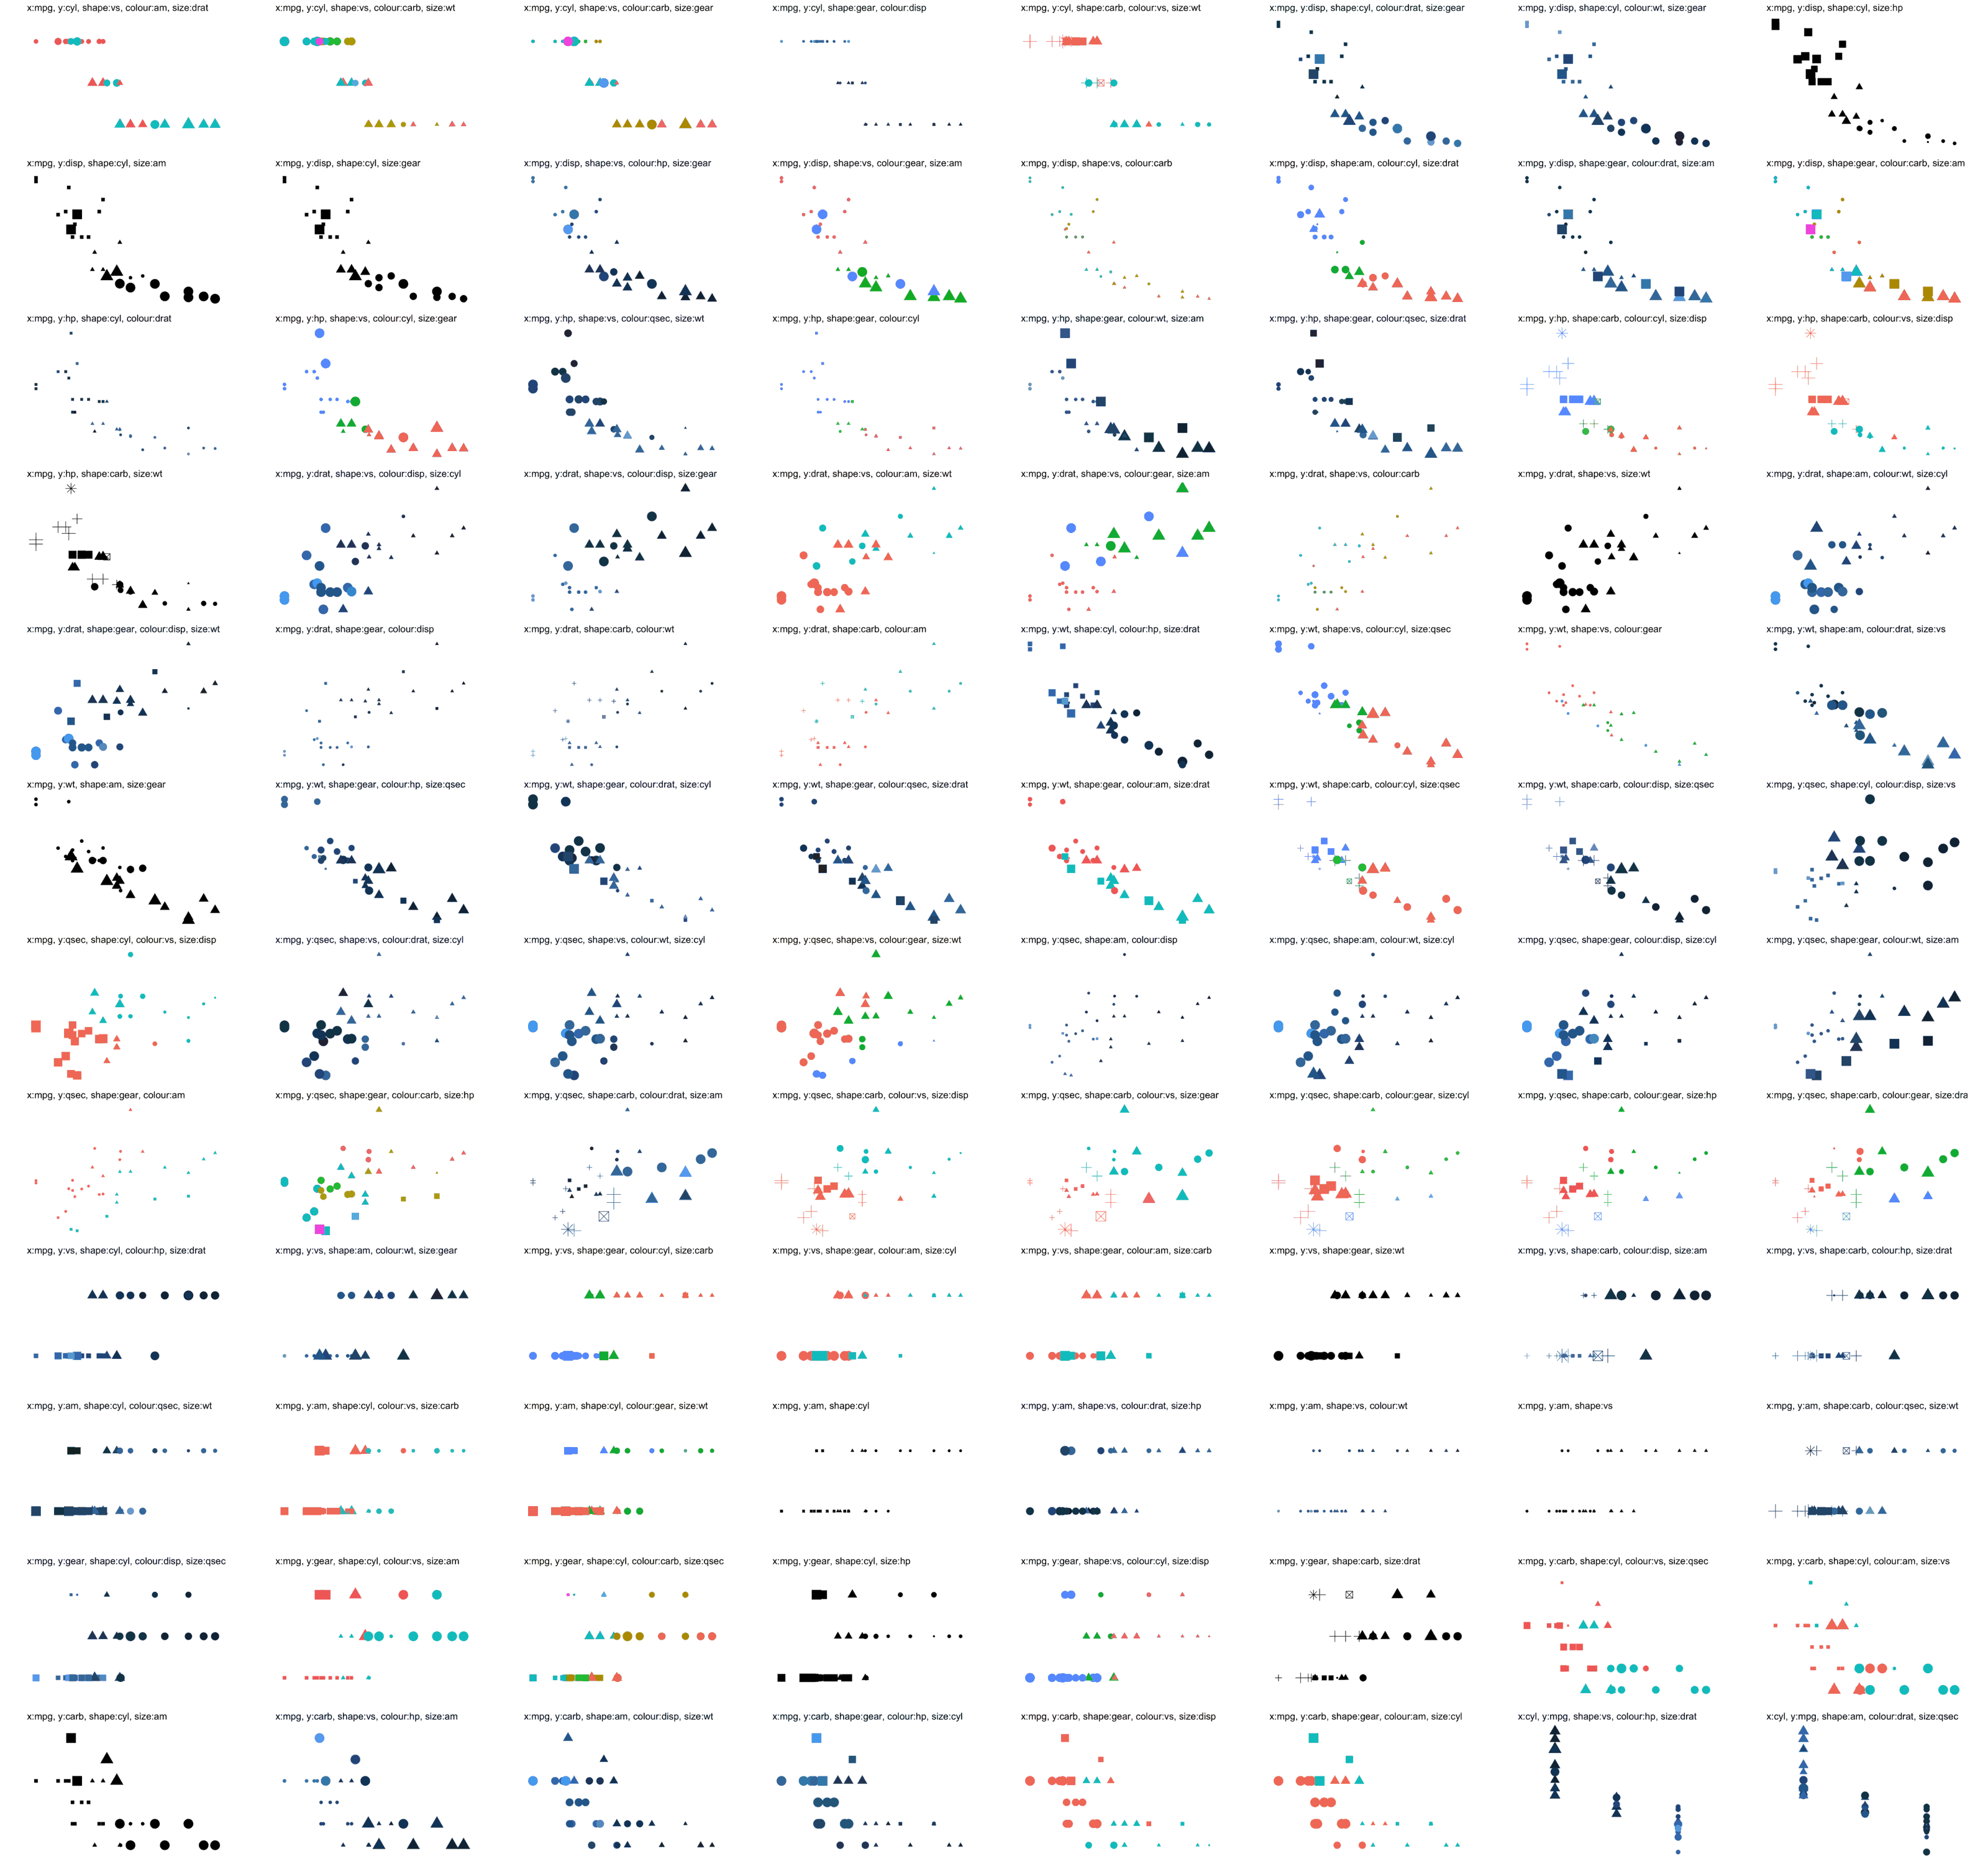
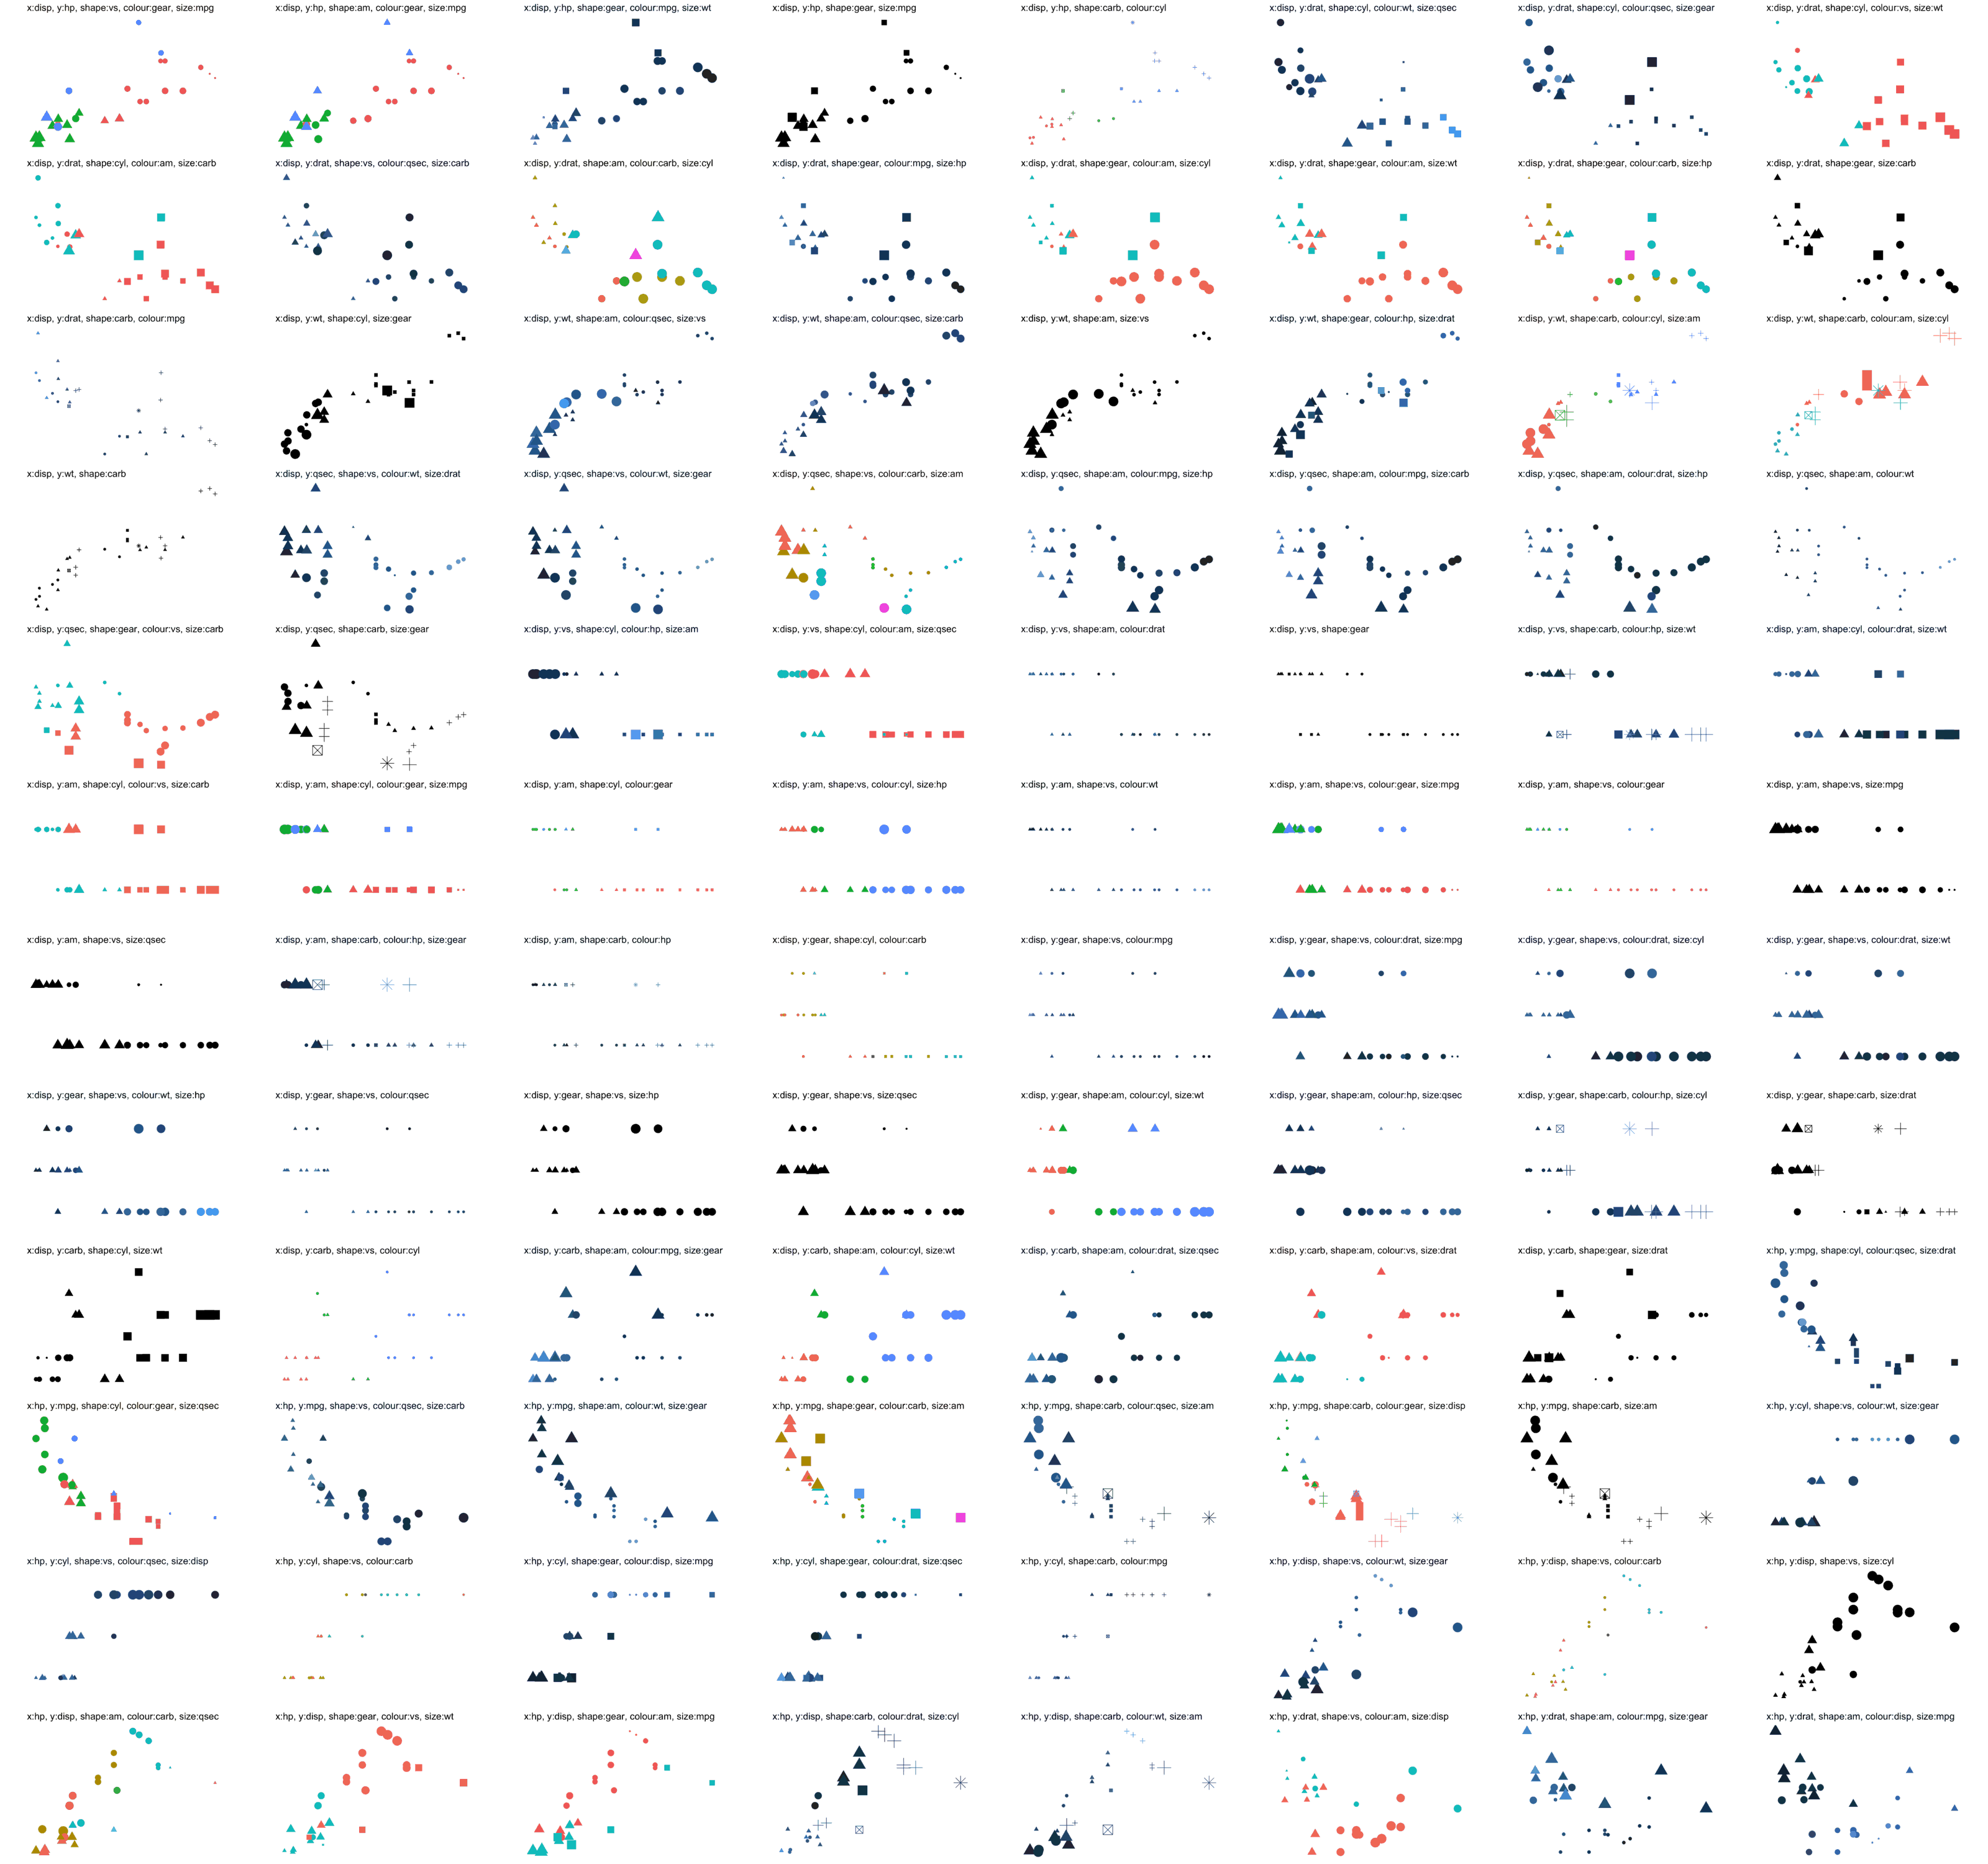
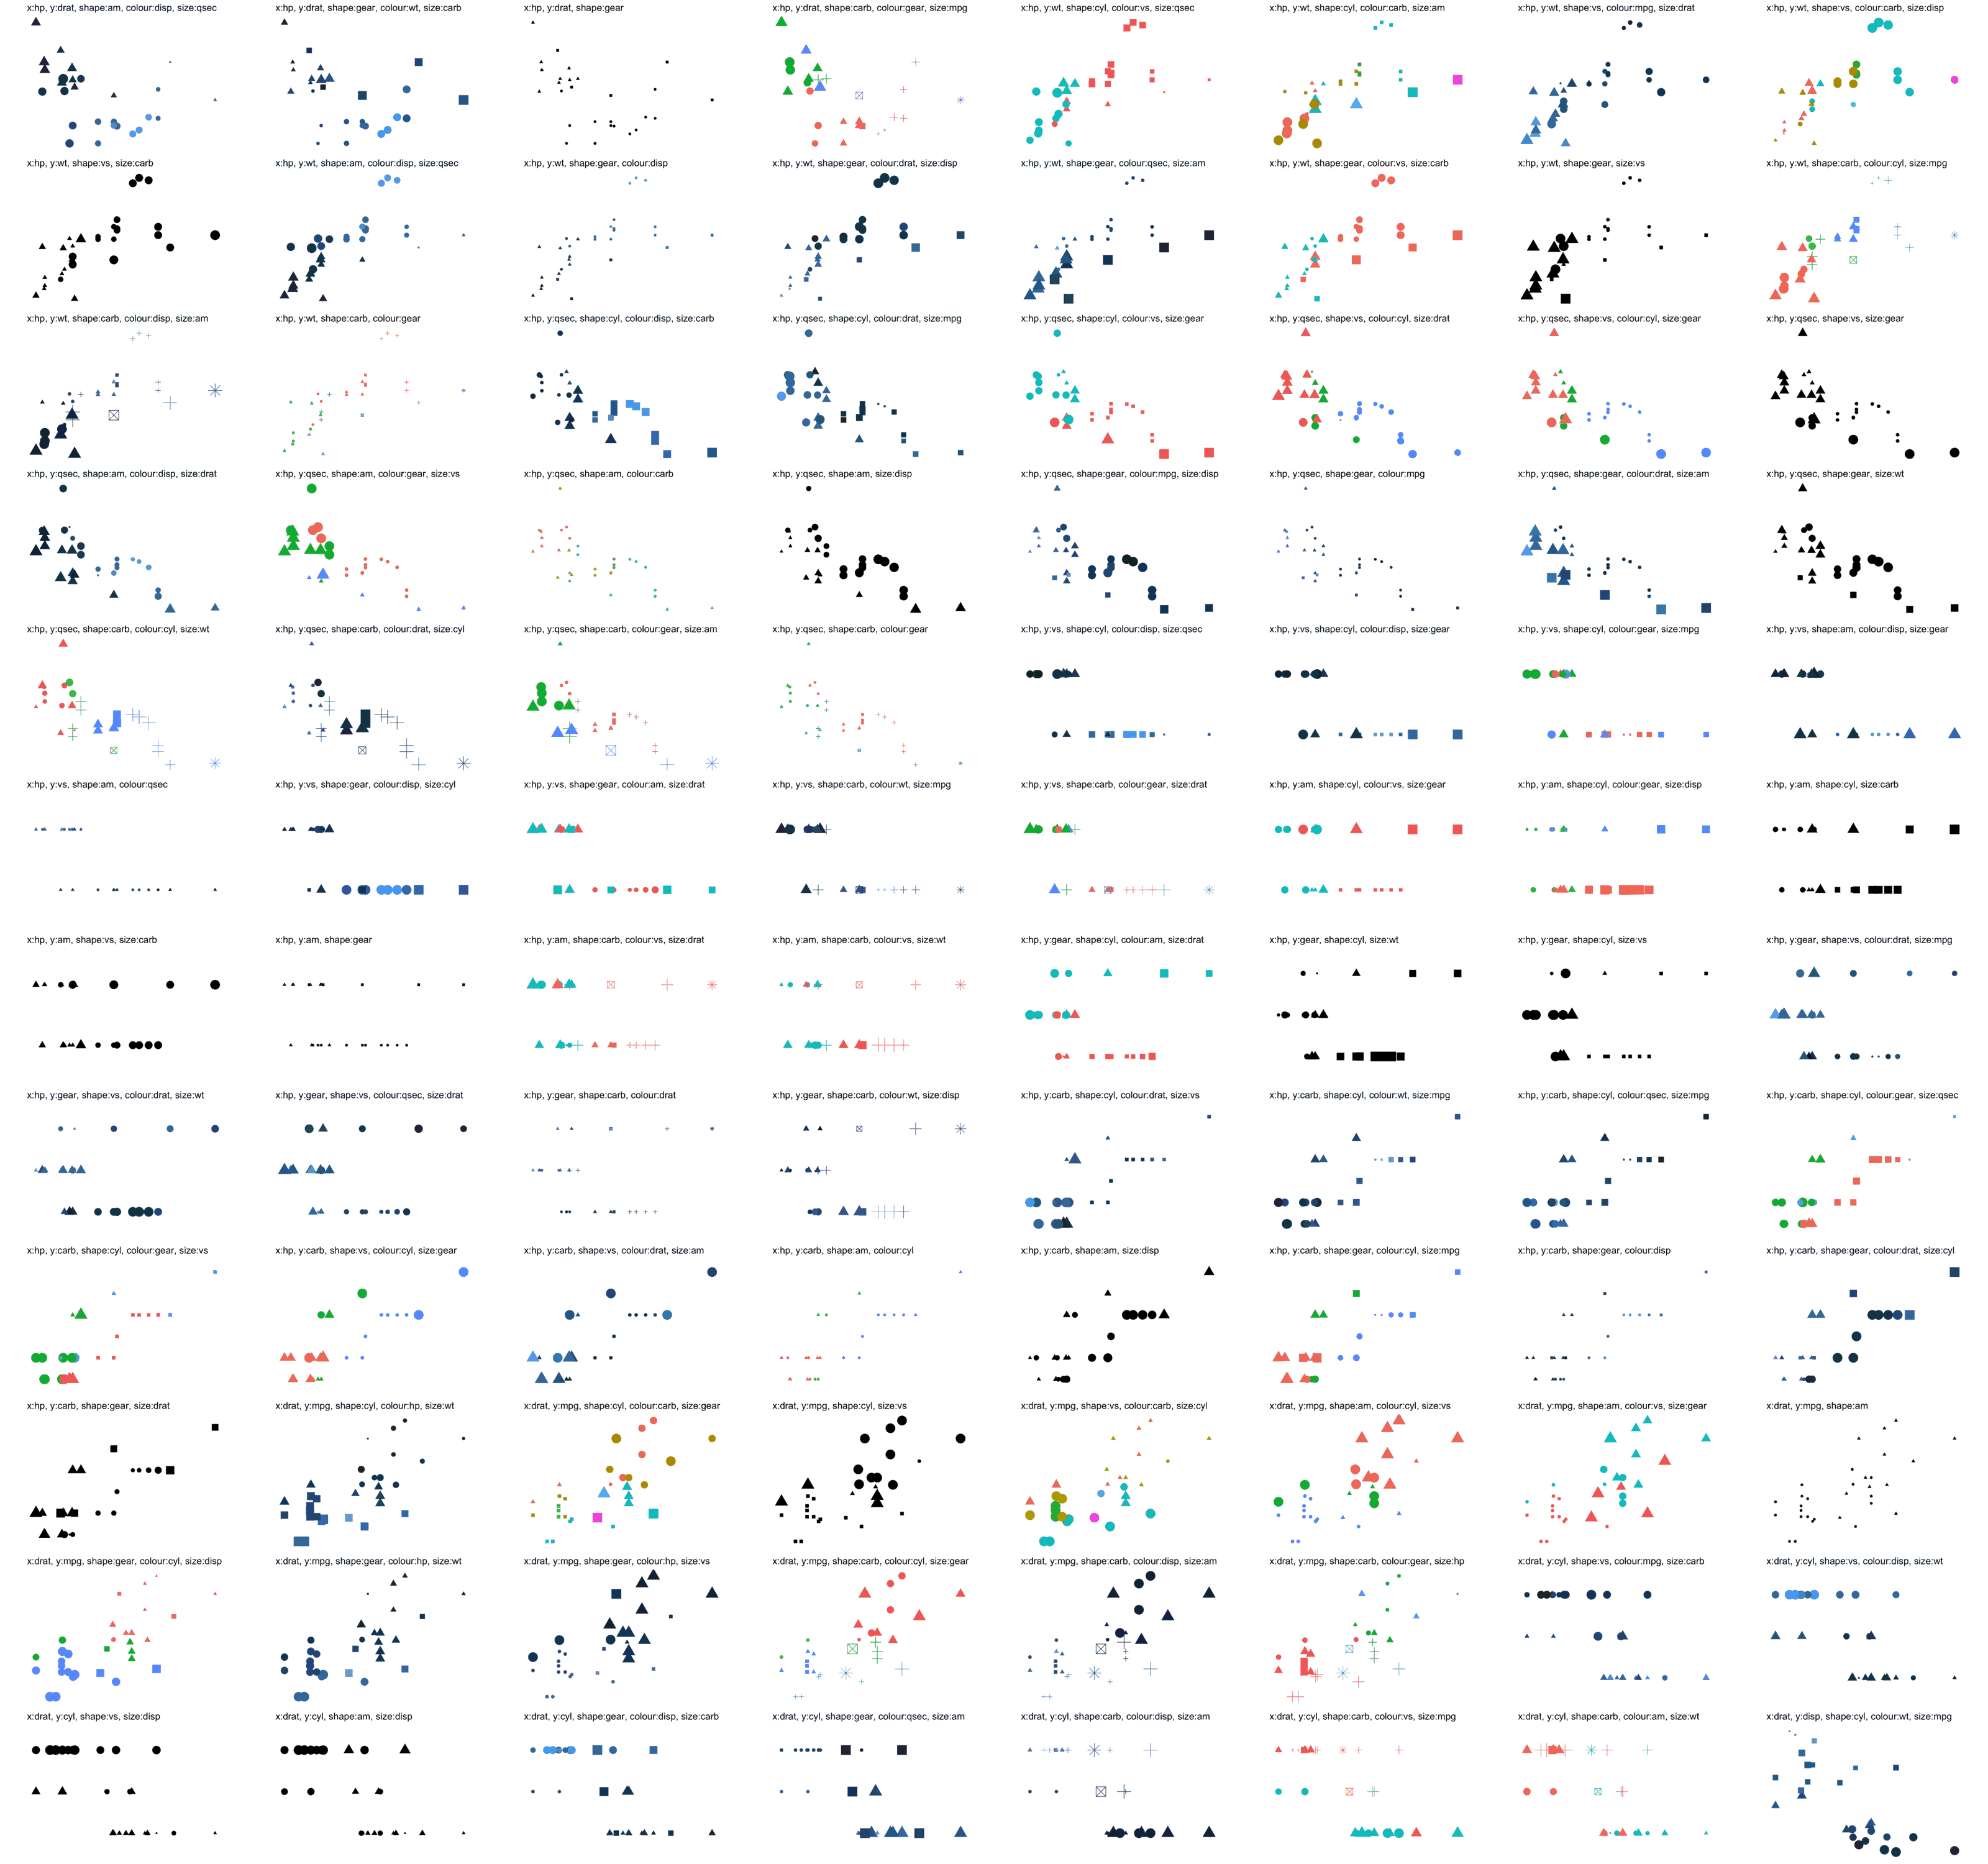
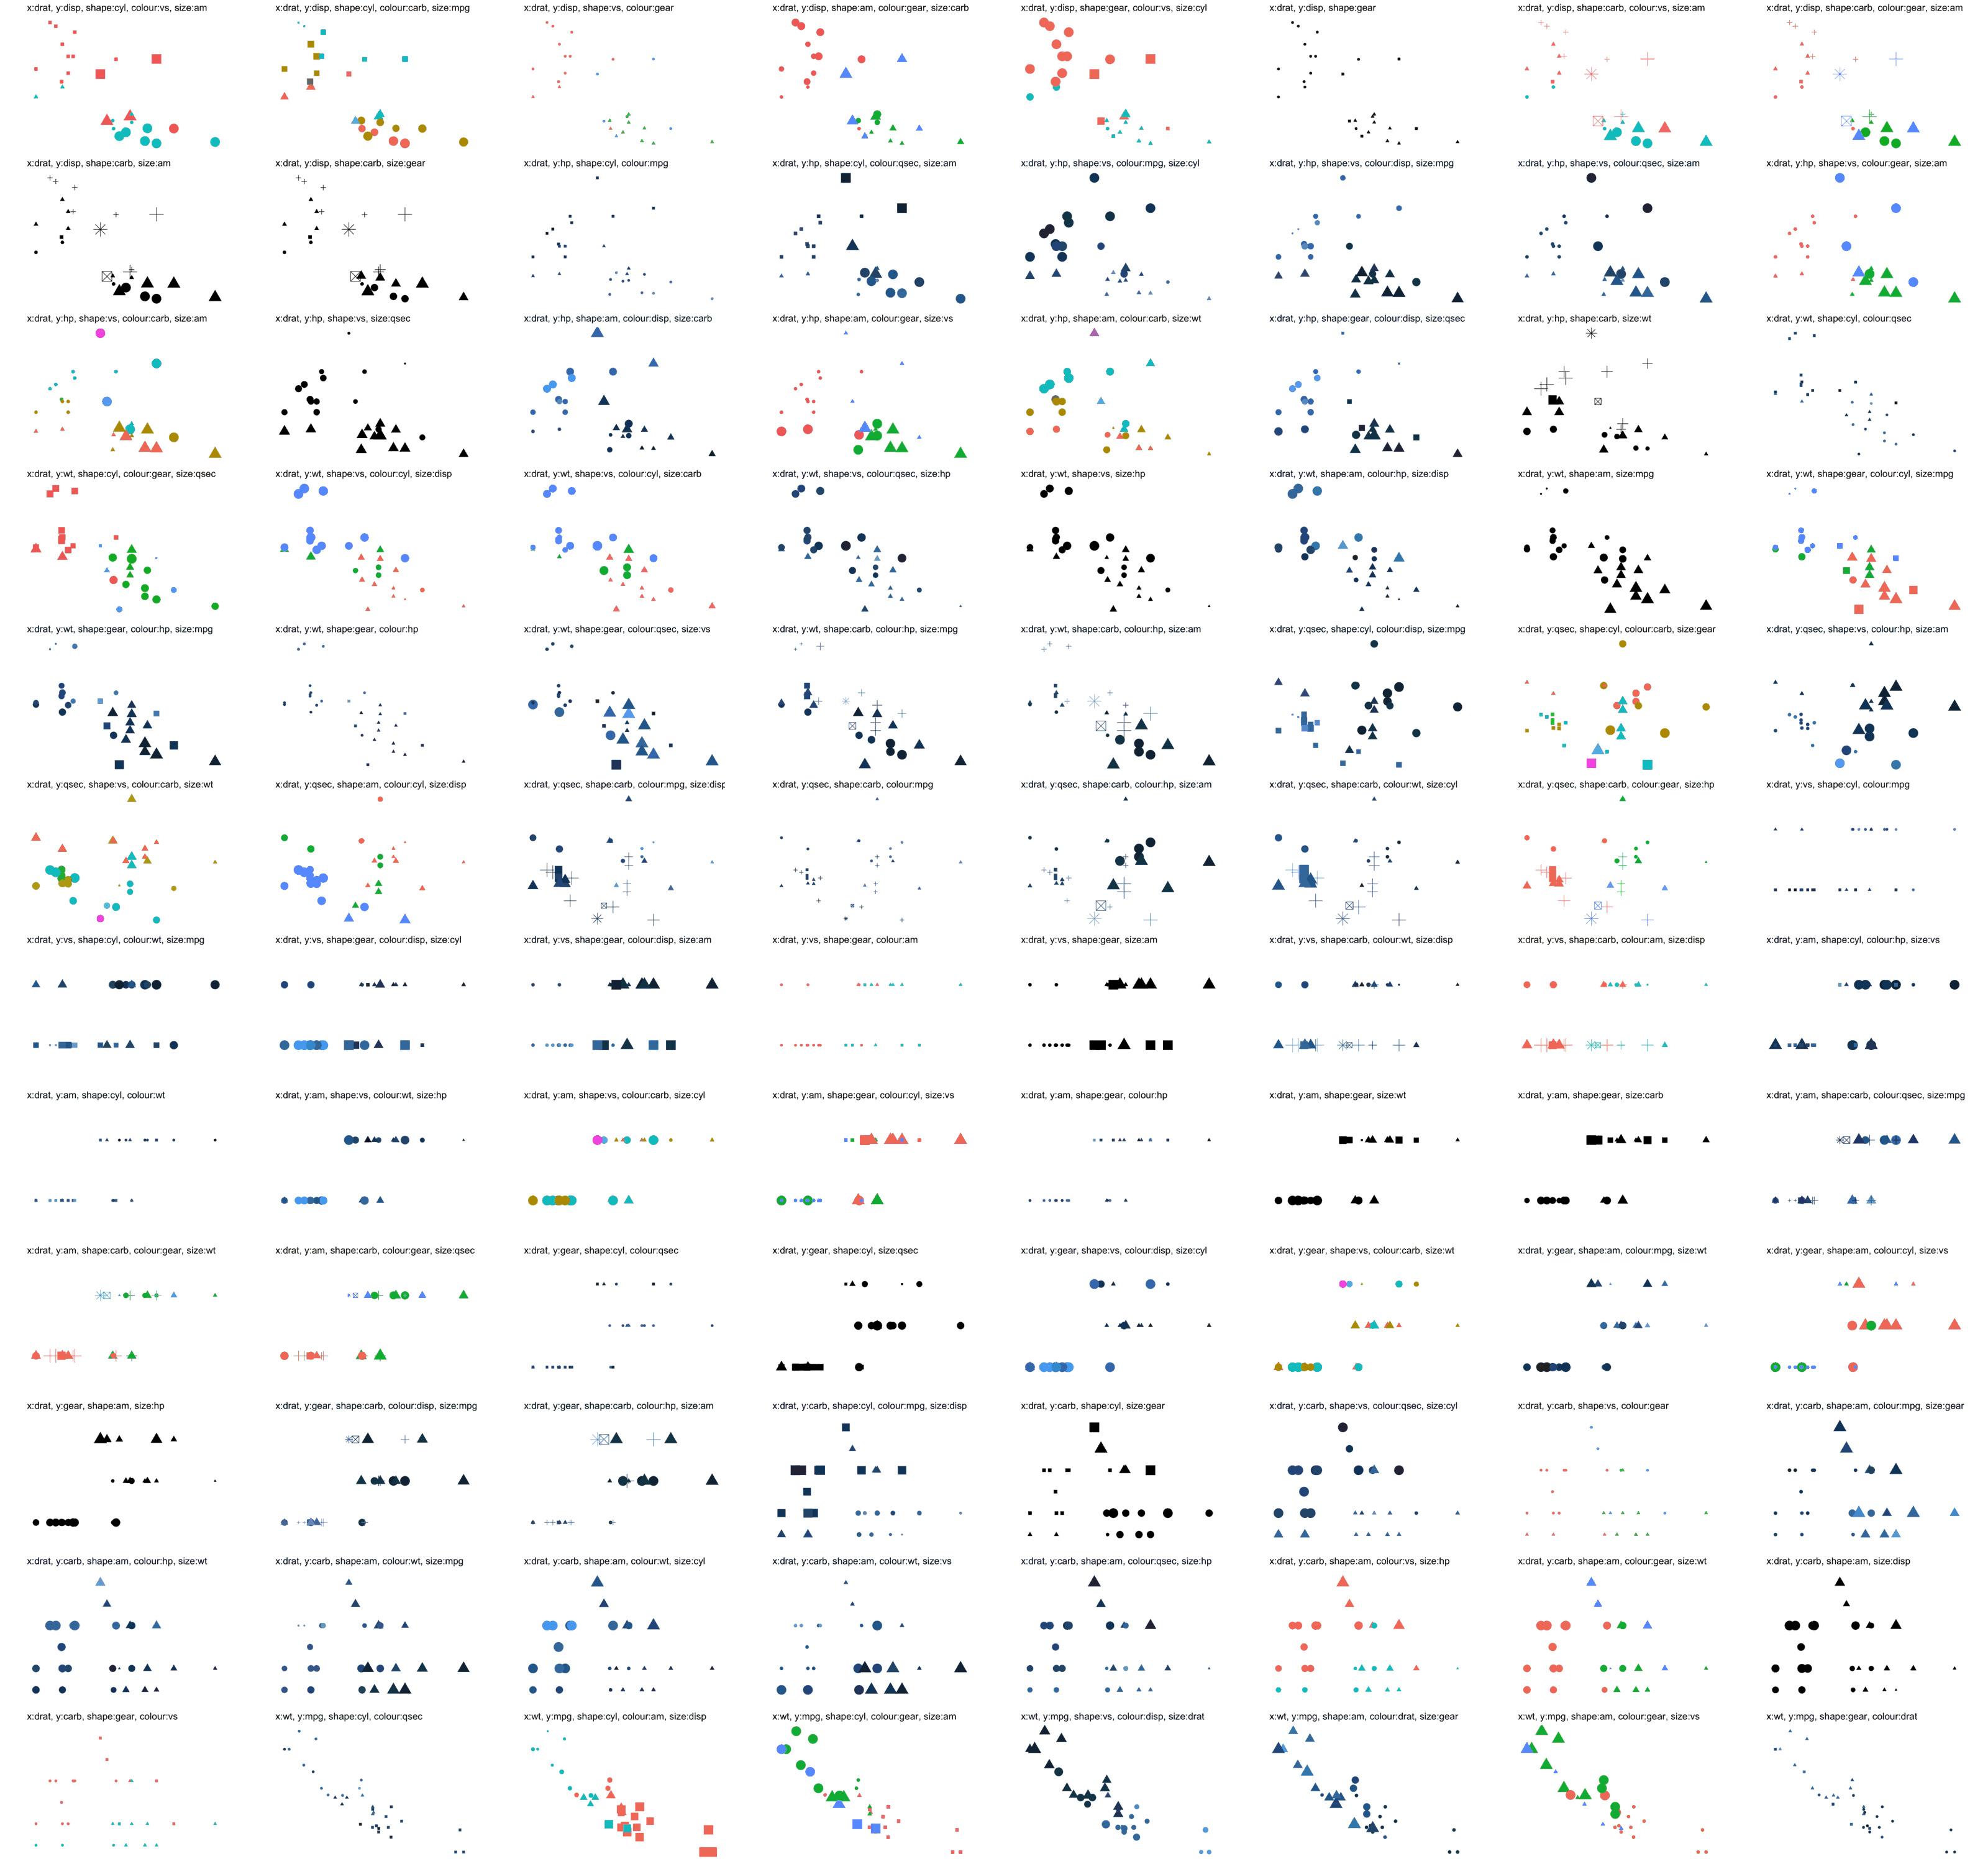
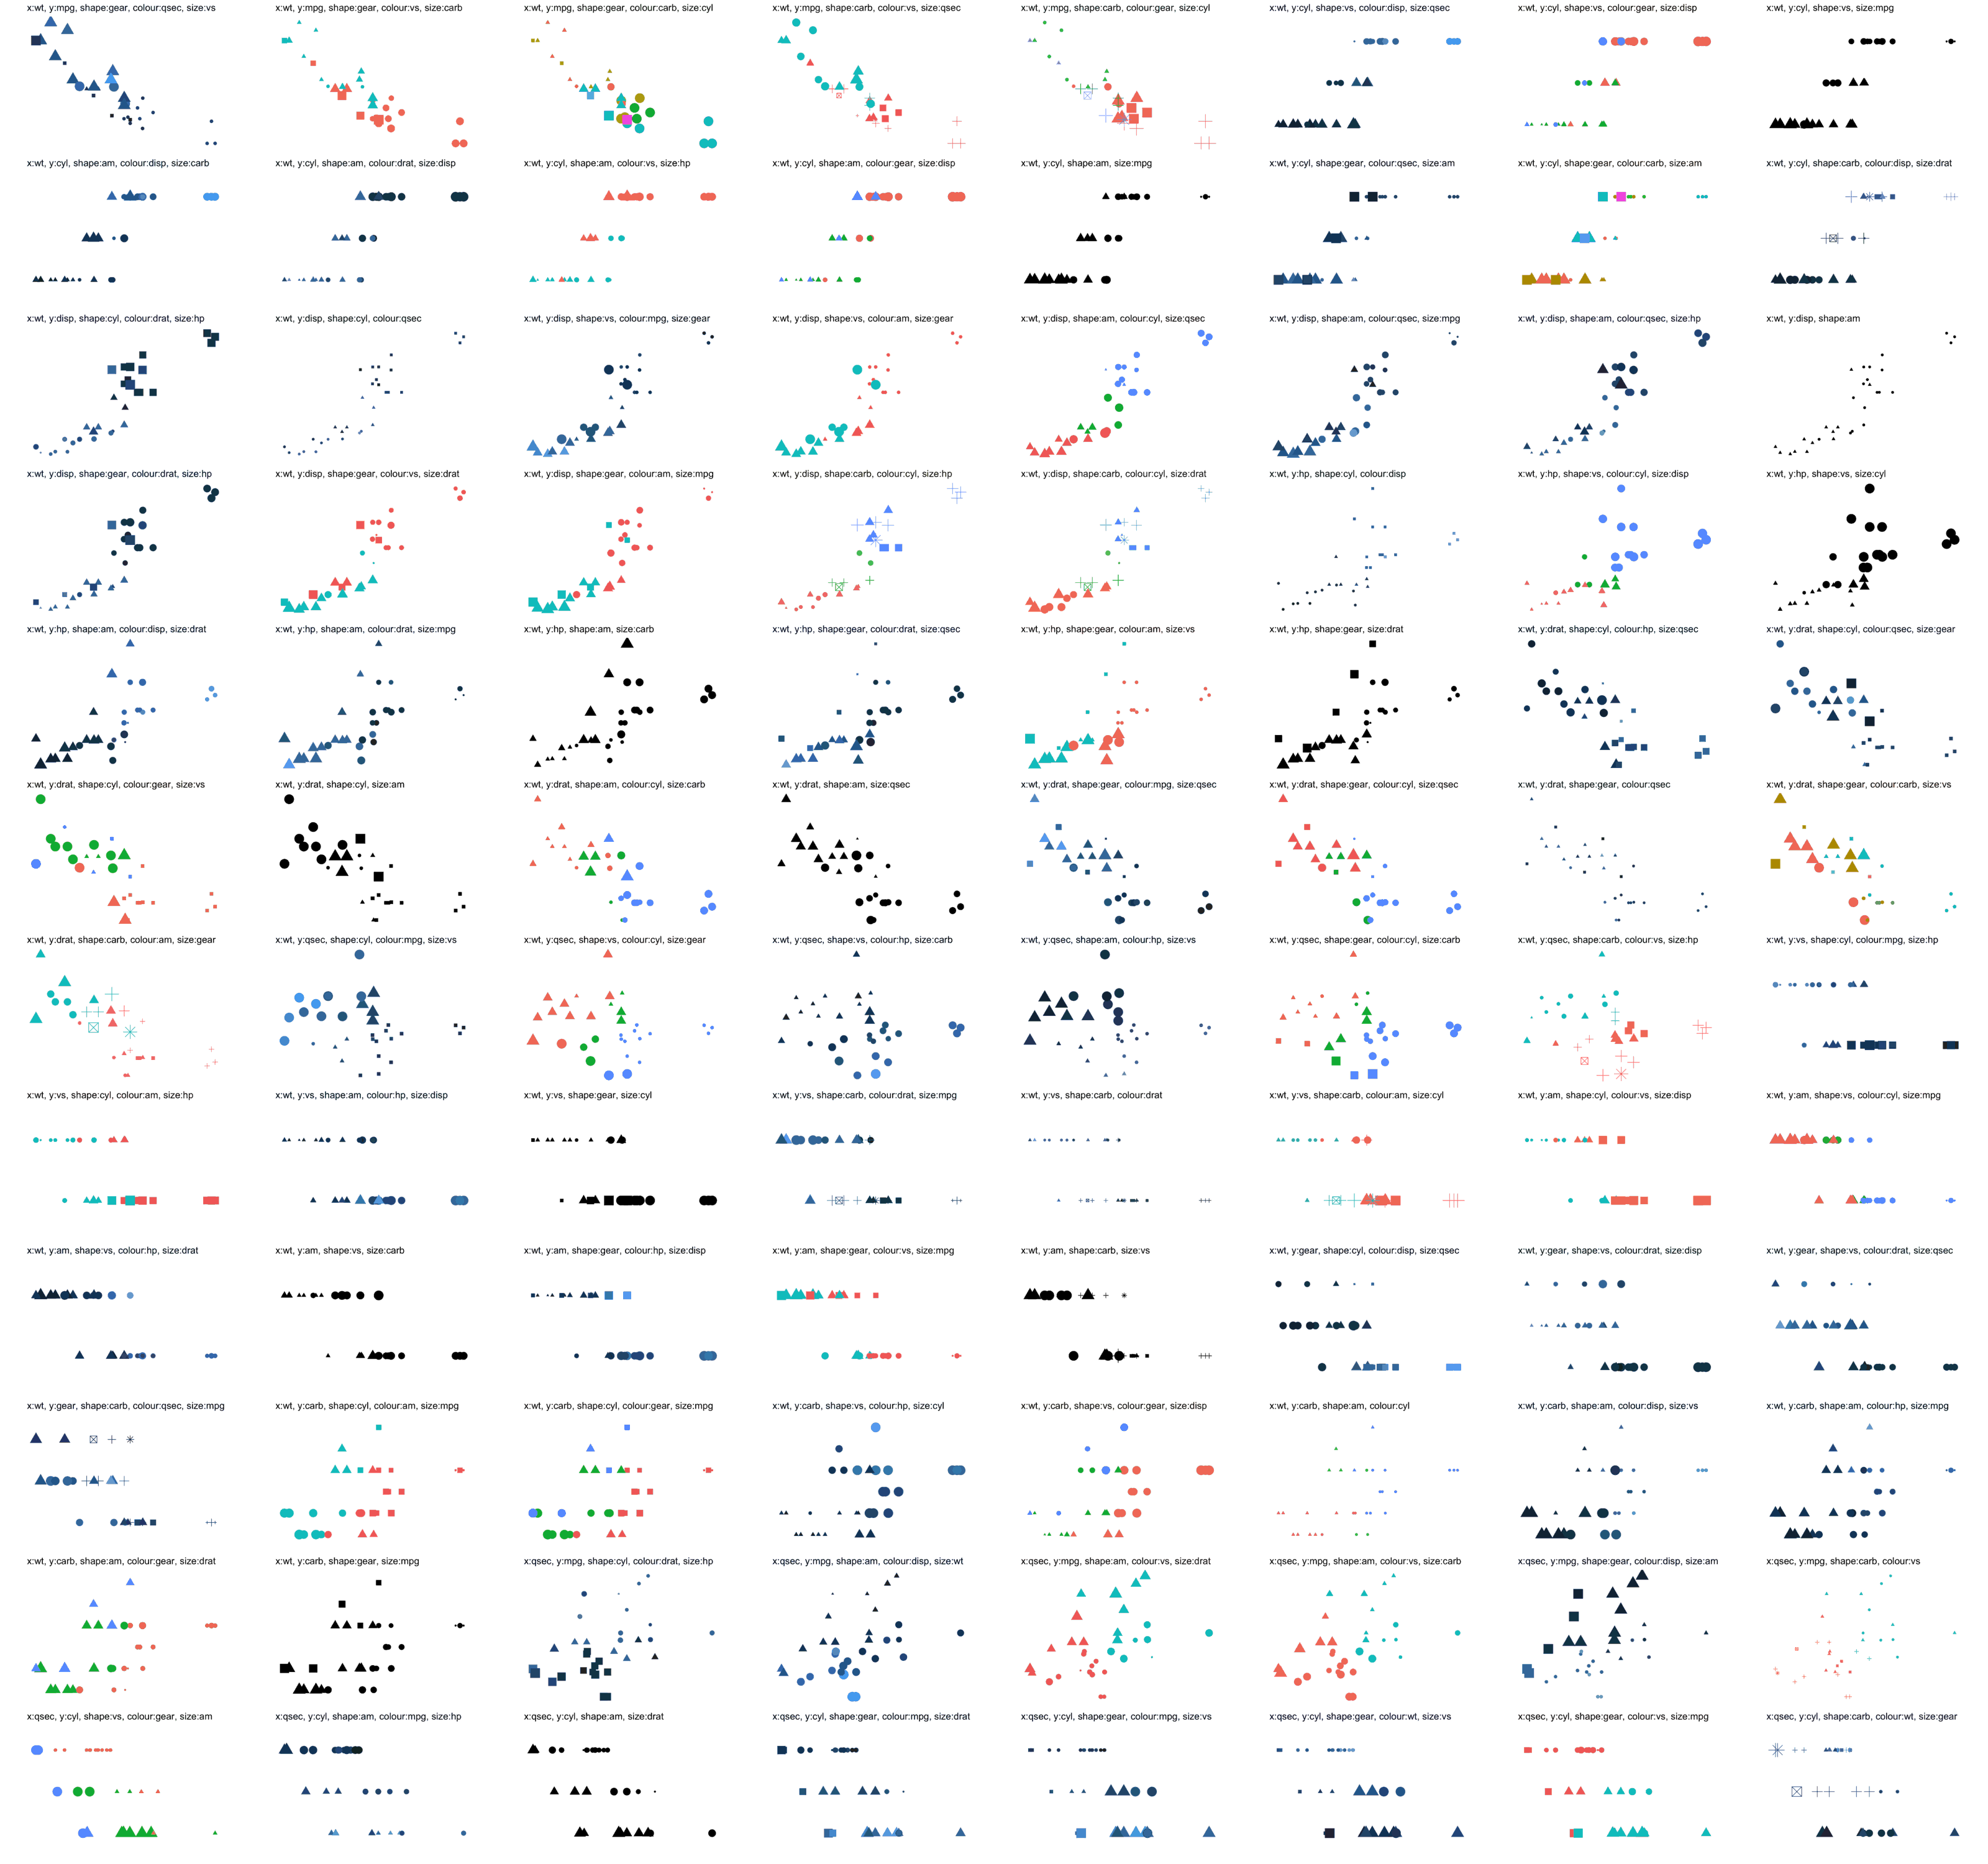
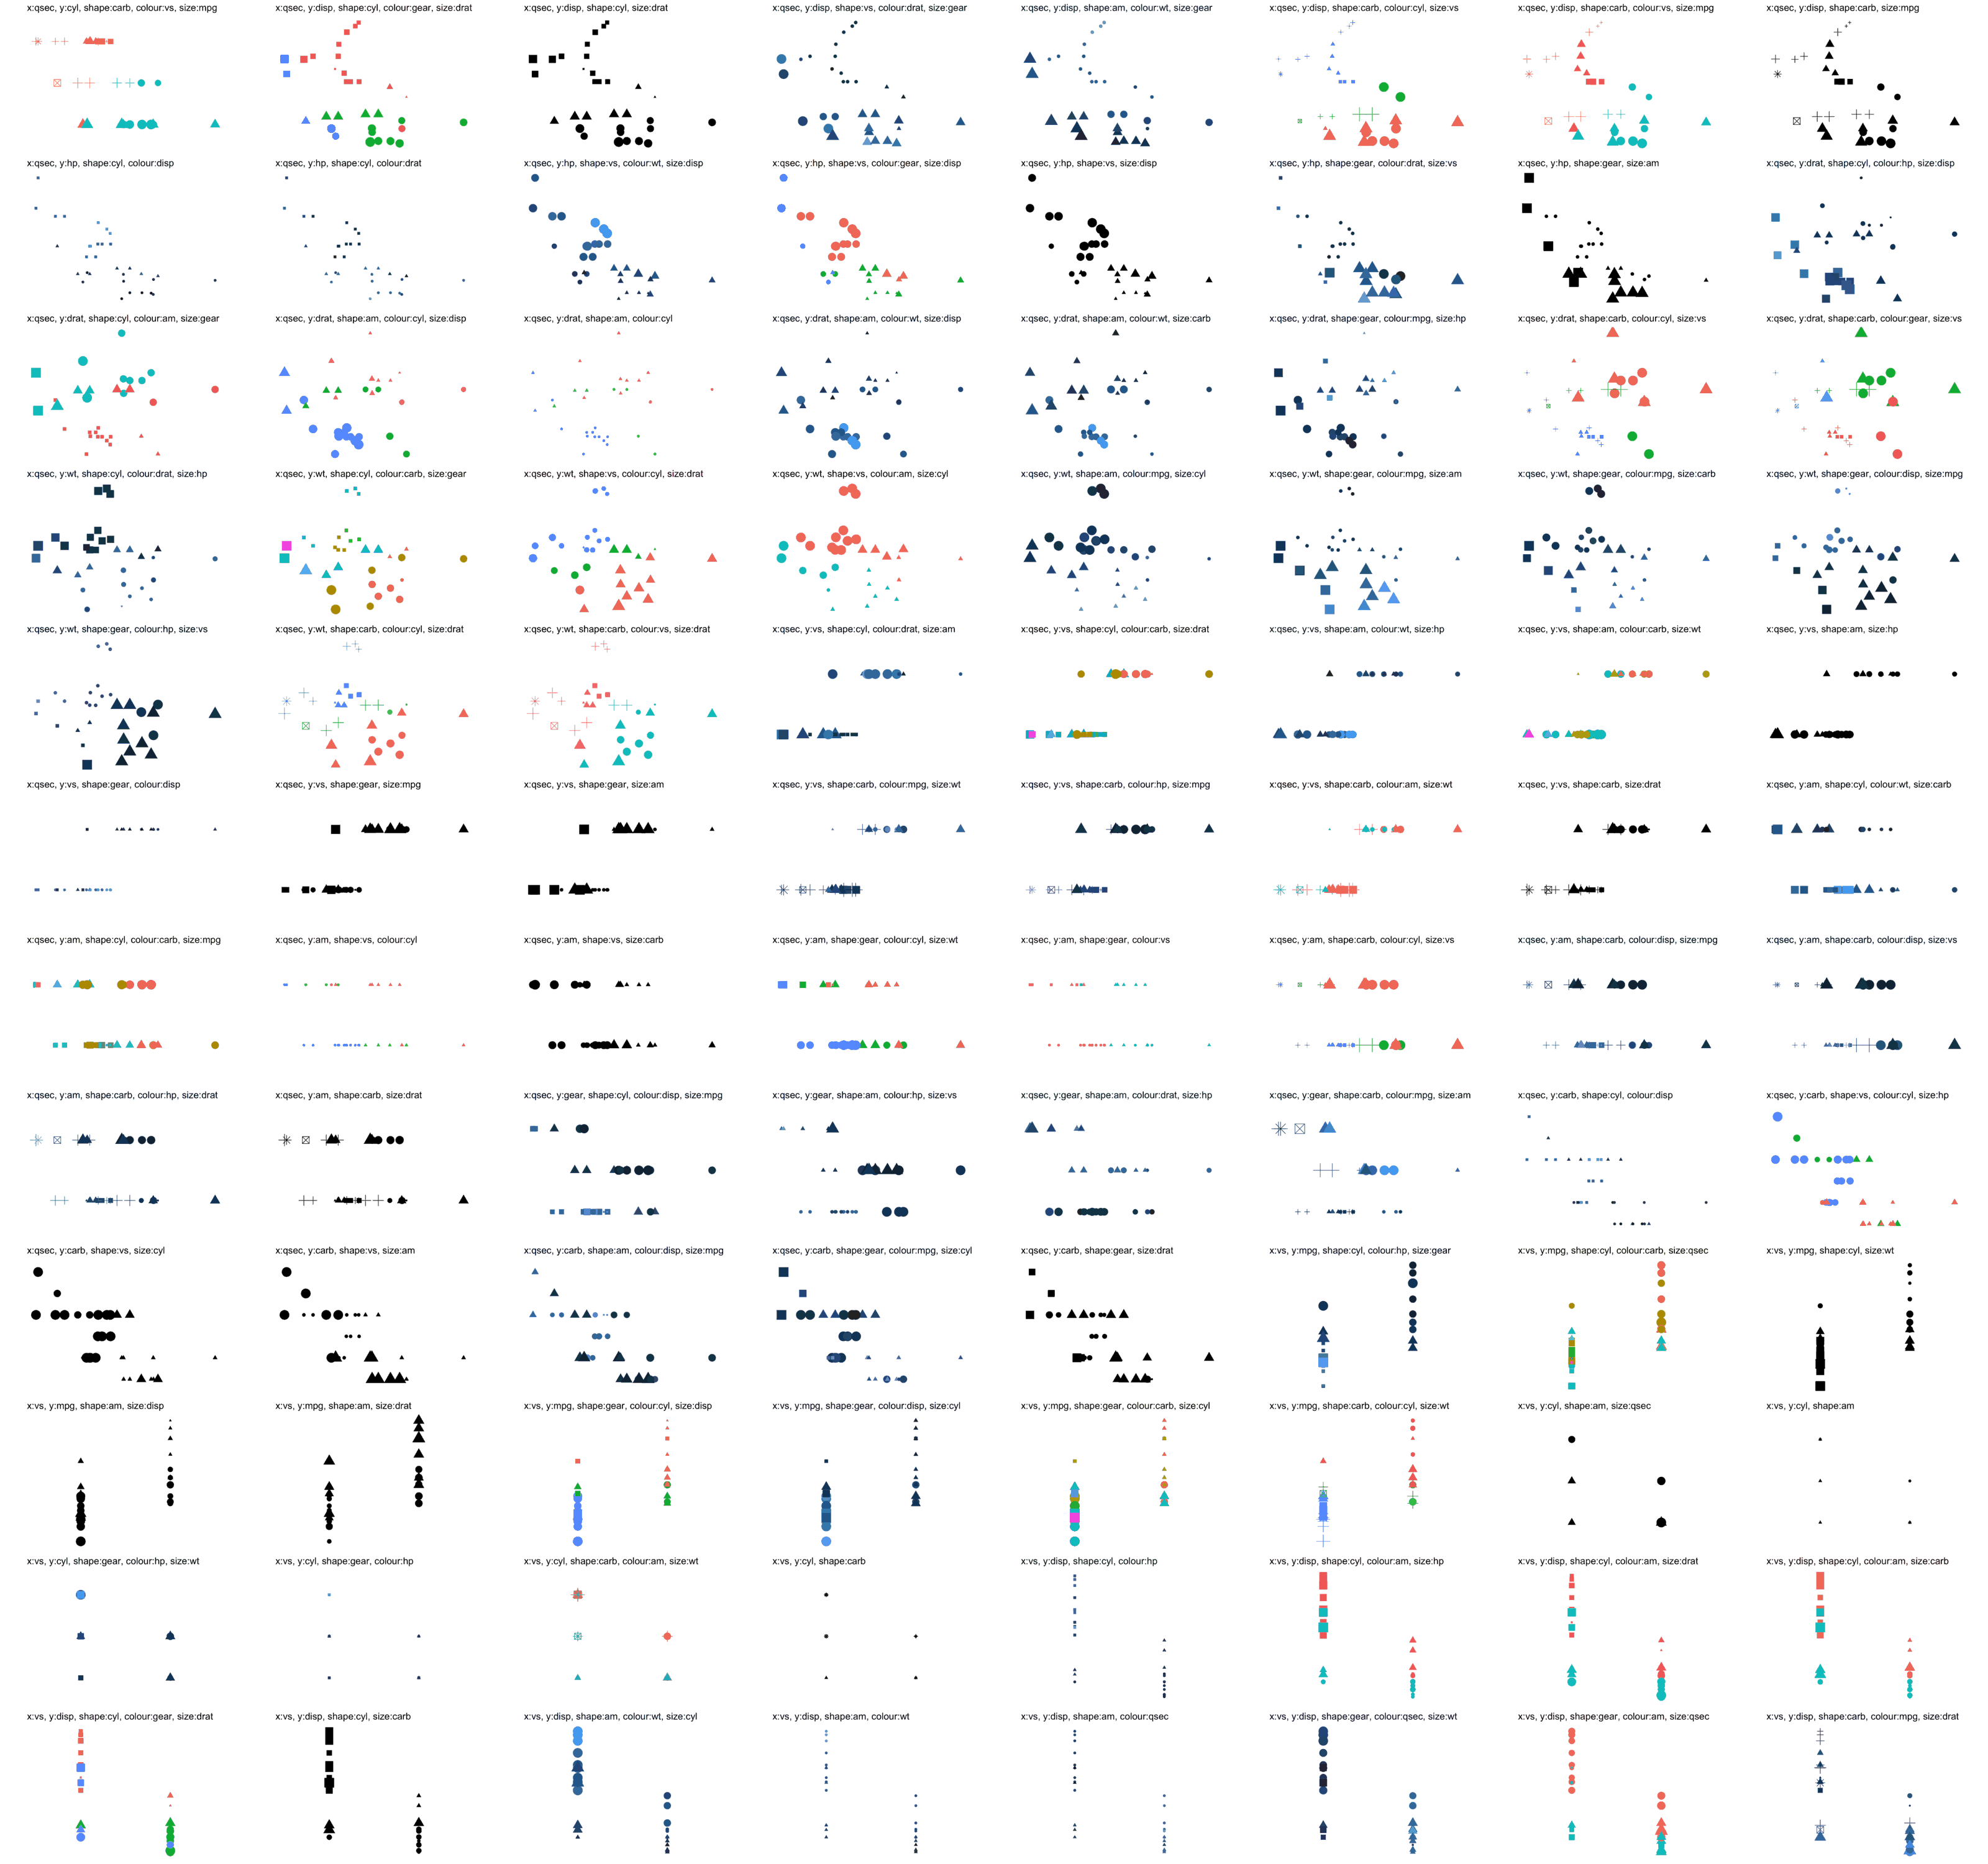
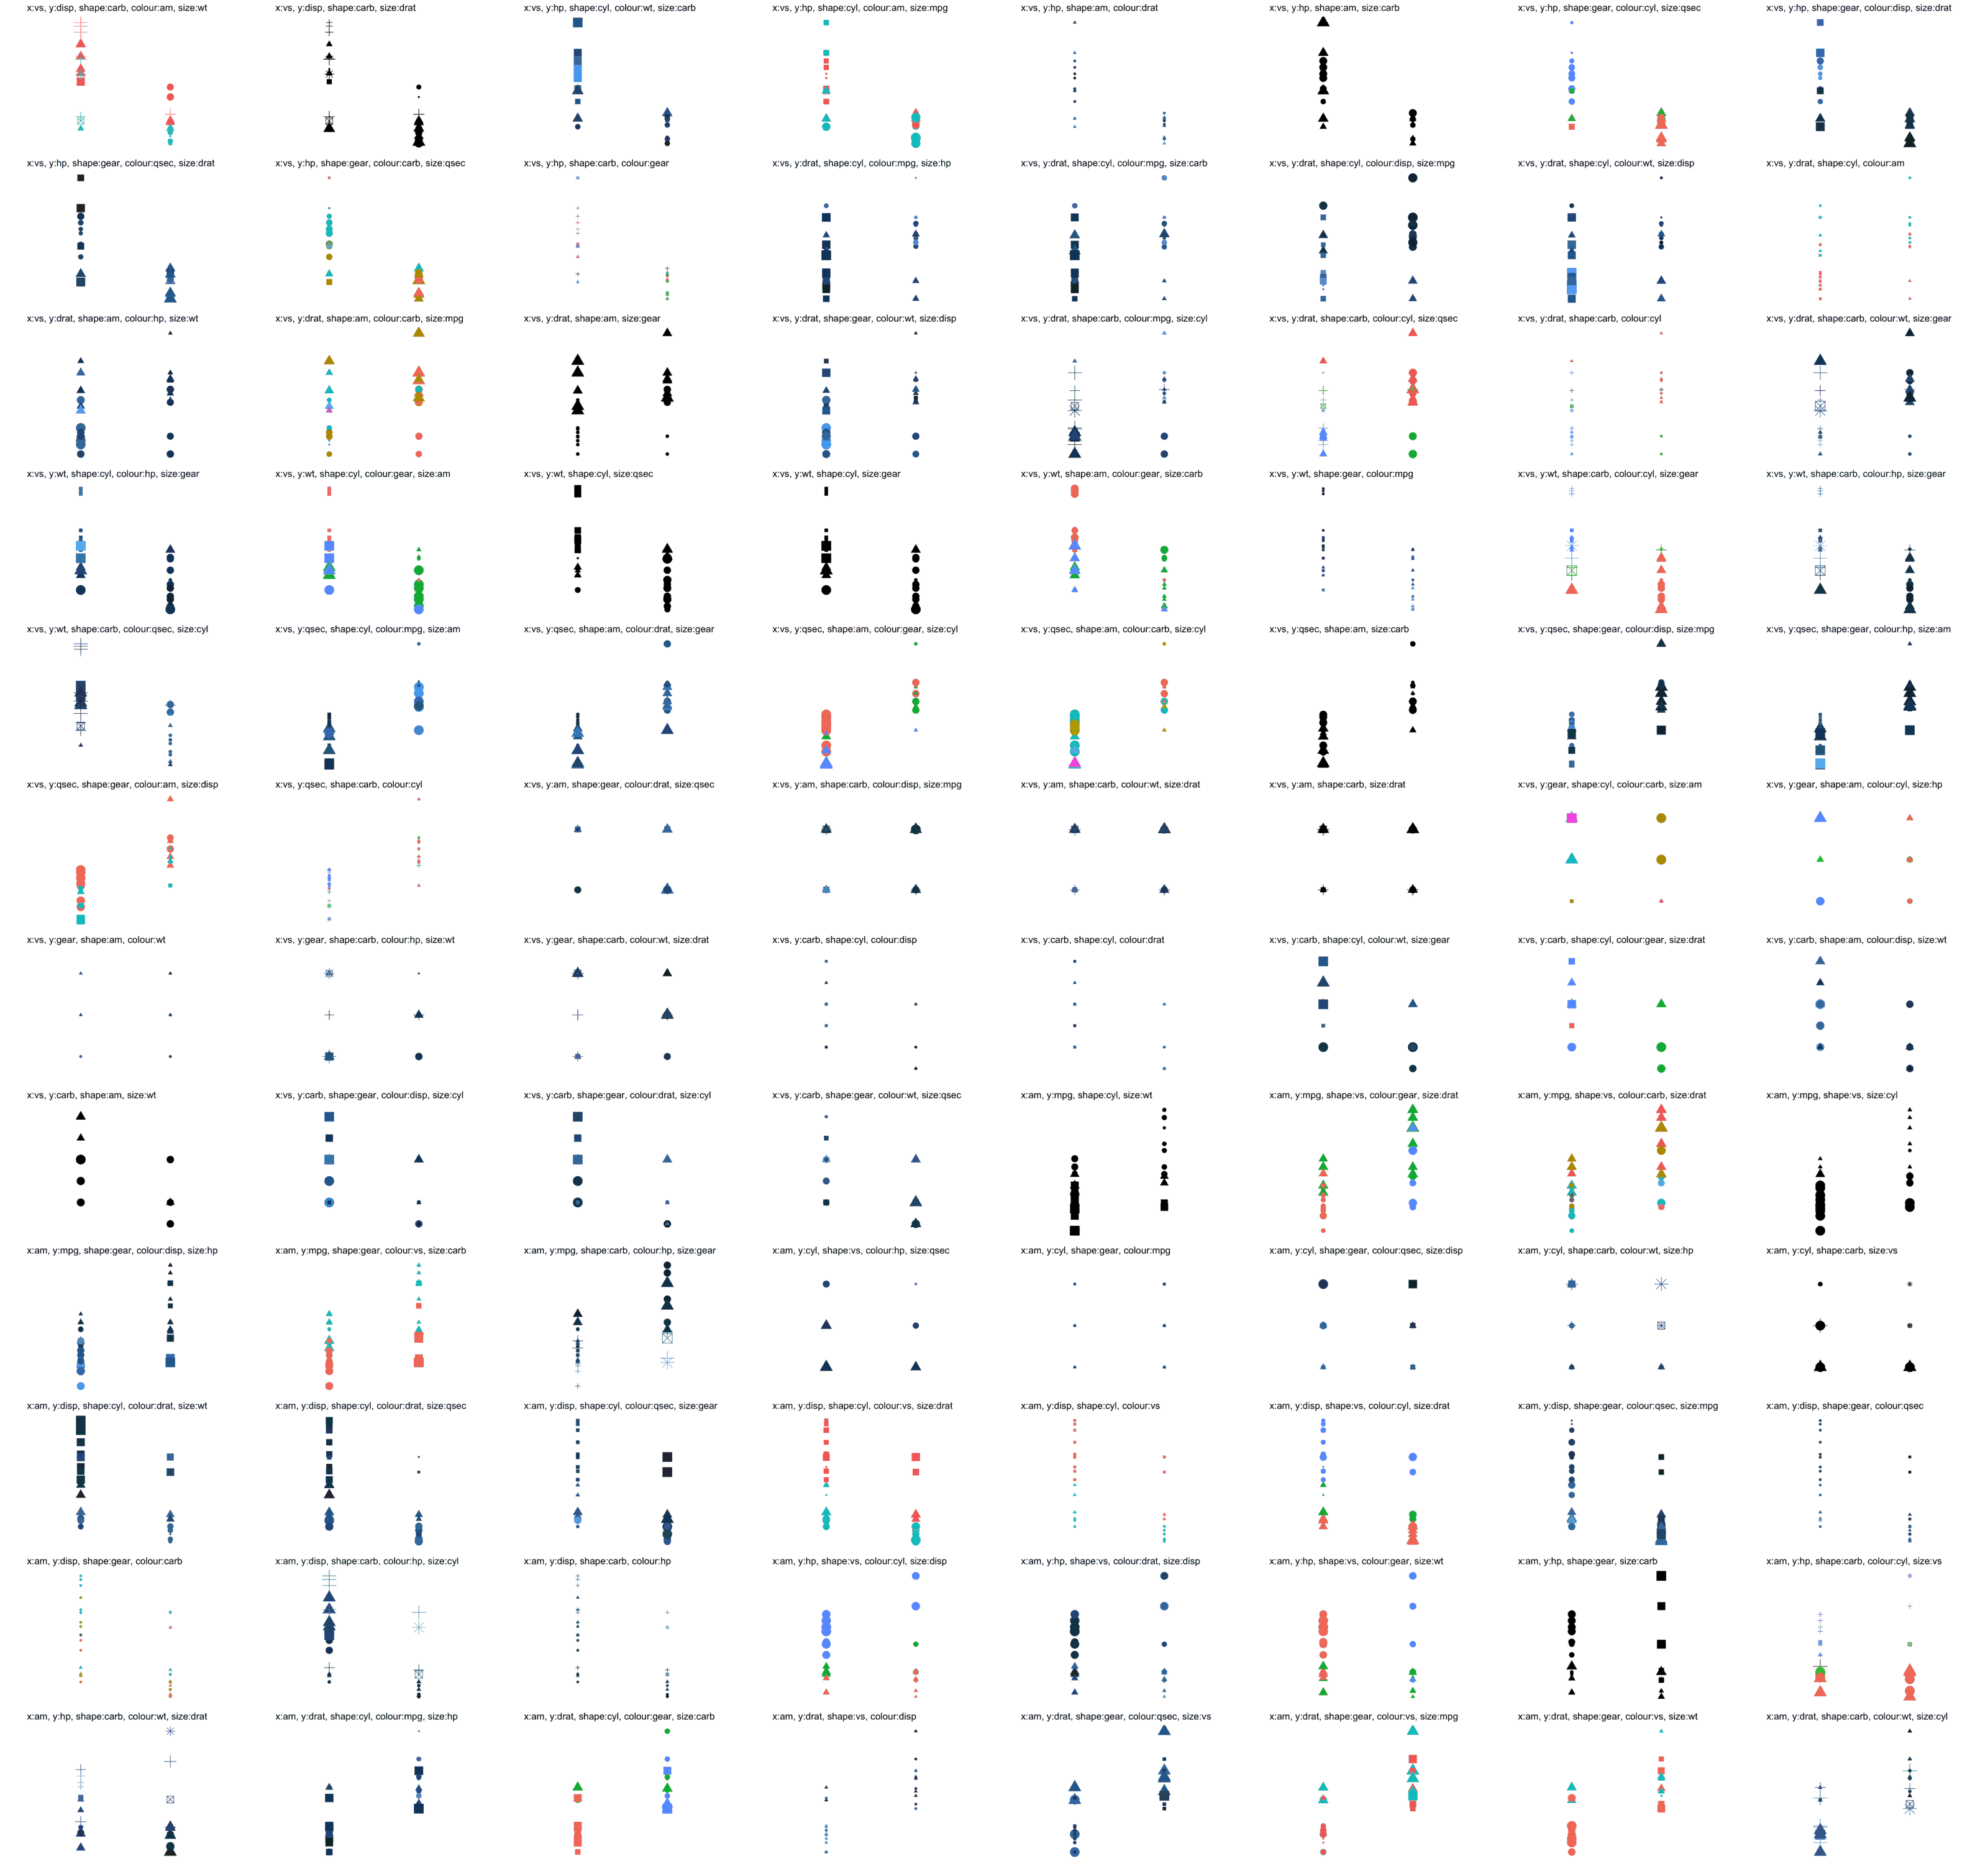
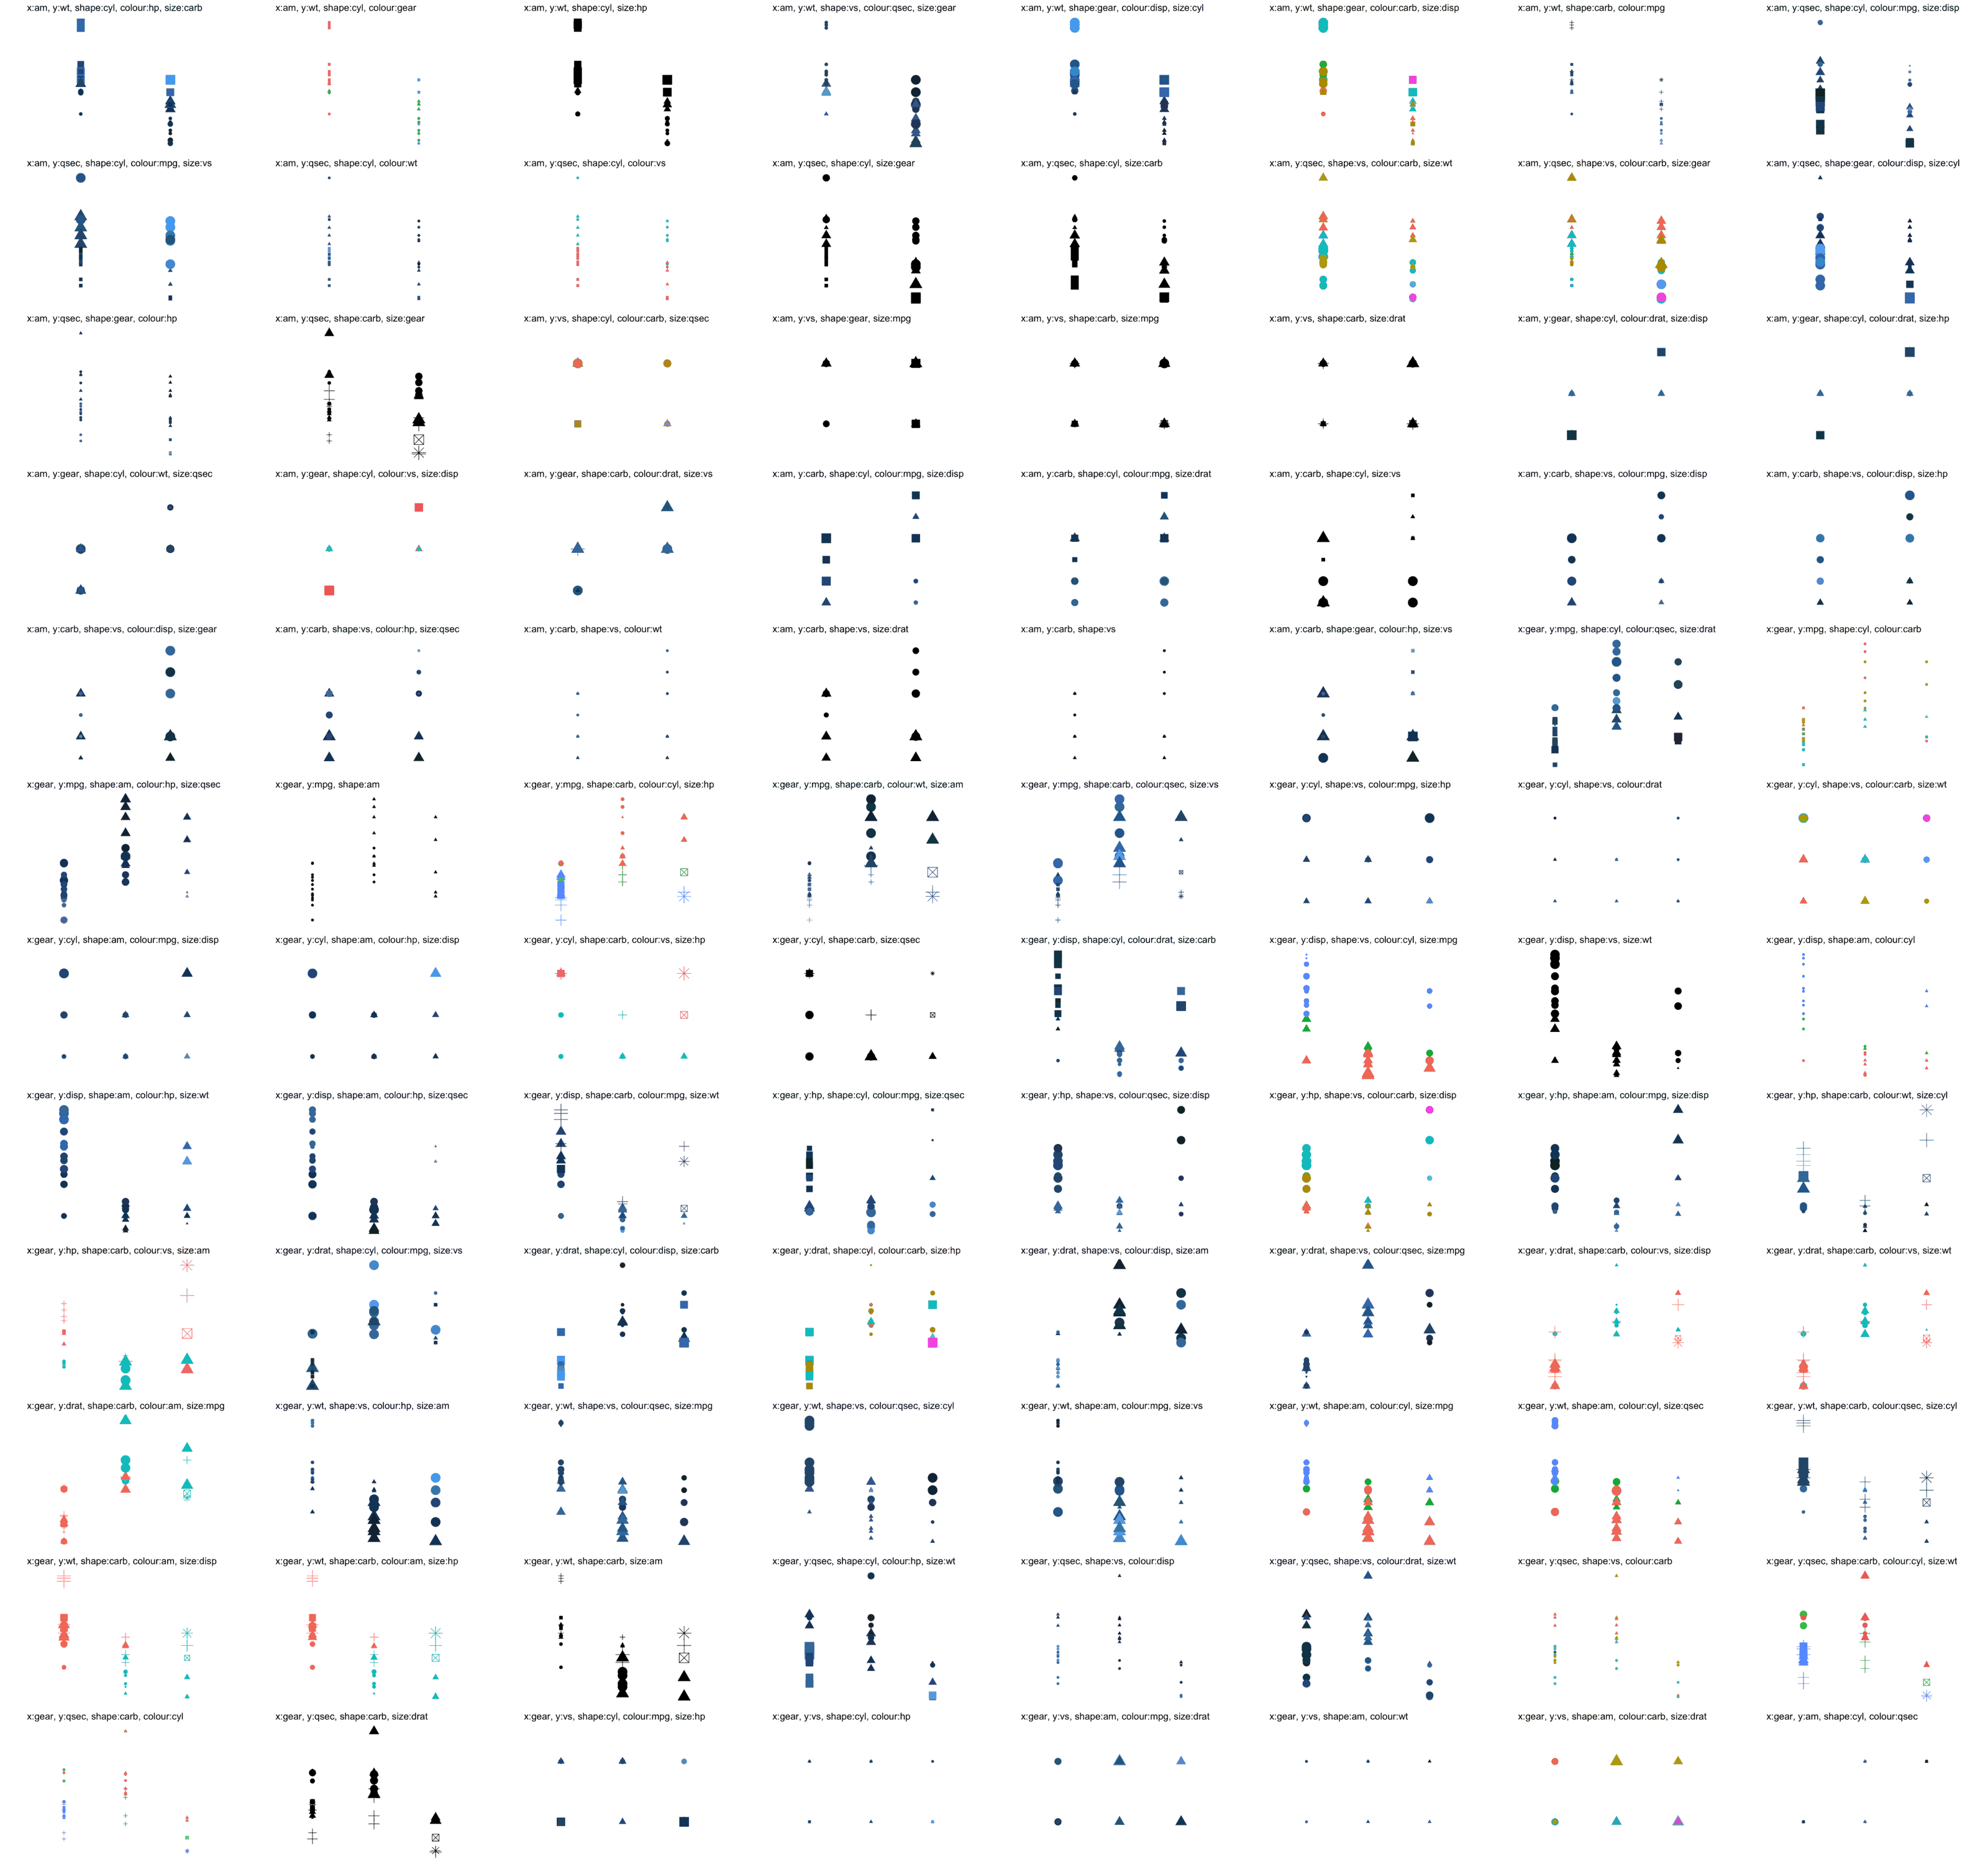
Sample of ~900 scatterplots (out of 32,850)
- Image title describes the mapping of variables to aesthetics.
- Click on the images below to see bigger versions.

Code
Prepare data for plotting
#~~~~~~~~~~~~~~~~~~~~~~~~~~~~~~~~~~~~~~~~~~~~~~~~~~~~~~~~~~~~~~~~~~~~~~~~~~~~~~
# Tools to prepare a dataset for plotting
#  - is_categorical() - rough test to see if variable is categorical
#  - enfactor()       - convert a variable to a factor if it has few unique values
#  - enfactor_df()    - convert variables in a data.frame to a factor
#  - get_cat_vars()   - get names of categorical variables in a data.frame
#  - get_cont_vars()  - get names of continuous variables in a data.frame
#~~~~~~~~~~~~~~~~~~~~~~~~~~~~~~~~~~~~~~~~~~~~~~~~~~~~~~~~~~~~~~~~~~~~~~~~~~~~~~
is_categorical <- function(x) {is.factor(x) || is.character(x)}
enfactor       <- function(x) {if (is_categorical(x) || n_distinct(x) > 10) x else as.factor(x)}
enfactor_df    <- function(df) {map_df(df, enfactor)}
get_cat_vars   <- function(df) { df %>% keep(is_categorical) %>% names() }
get_cont_vars  <- function(df) { df %>%  discard(is_categorical) %>% names() }


#~~~~~~~~~~~~~~~~~~~~~~~~~~~~~~~~~~~~~~~~~~~~~~~~~~~~~~~~~~~~~~~~~~~~~~~~~~~~~~
# Prepare the dataset to plot
#~~~~~~~~~~~~~~~~~~~~~~~~~~~~~~~~~~~~~~~~~~~~~~~~~~~~~~~~~~~~~~~~~~~~~~~~~~~~~~
plot_df   <- enfactor_df(mtcars)
all_vars  <- colnames(plot_df)
cat_vars  <- get_cat_vars(plot_df)
cont_vars <- get_cont_vars(plot_df)
Determine every combination of variable-to-aesthetic mapping for geom_point()
#~~~~~~~~~~~~~~~~~~~~~~~~~~~~~~~~~~~~~~~~~~~~~~~~~~~~~~~~~~~~~~~~~~~~~~~~~~~~~
#' Assign variables to an aesthetic
#'
#' - Assigning N variables to M aesthetics
#' - Allows 'optional' aesthetics to be not assigned
#'
#' @param cols the column names in the data.frame
#' @param aesthetic the list of aesthetics
#' @param current_vars vector of current variable names
#' @param depth = current recursion depth
#~~~~~~~~~~~~~~~~~~~~~~~~~~~~~~~~~~~~~~~~~~~~~~~~~~~~~~~~~~~~~~~~~~~~~~~~~~~~~
assign_vars <- function(cols, aesthetics, current_vars = c(), depth = 1L) {
  if (depth > aesthetics$N) {
    if (length(current_vars) == aesthetics$N) {
      return(list(current_vars))
    } else {
      print("ugh")
      print(current_vars)
      return(NULL)
    }
  }

  #~~~~~~~~~~~~~~~~~~~~~~~~~~~~~~~~~~~~~~~~~~~~~~~~~~~~~~~~~~~~~~~~~~~~~~~~~~~
  # Recursively assign the remaining columns to an aesthetic
  #~~~~~~~~~~~~~~~~~~~~~~~~~~~~~~~~~~~~~~~~~~~~~~~~~~~~~~~~~~~~~~~~~~~~~~~~~~~
  res <- cols %>%
    imap(~assign_vars(cols[-.y], aesthetics, c(current_vars, .x), depth + 1L))

  #~~~~~~~~~~~~~~~~~~~~~~~~~~~~~~~~~~~~~~~~~~~~~~~~~~~~~~~~~~~~~~~~~~~~~~~~~~~
  # If we're run out of variables, but still have some aesthetics,
  # then mark the aesthetics as being mapped to '.na'.  Filter later.
  #~~~~~~~~~~~~~~~~~~~~~~~~~~~~~~~~~~~~~~~~~~~~~~~~~~~~~~~~~~~~~~~~~~~~~~~~~~~
  if (depth > length(aesthetics$required_aes)) {
    extra <- assign_vars(cols, aesthetics, c(current_vars, '.na'), depth + 1L)
    res <- c(res, list(extra))
  }

  #~~~~~~~~~~~~~~~~~~~~~~~~~~~~~~~~~~~~~~~~~~~~~~~~~~~~~~~~~~~~~~~~~~~~~~~~~~~
  # Flatten and return
  #~~~~~~~~~~~~~~~~~~~~~~~~~~~~~~~~~~~~~~~~~~~~~~~~~~~~~~~~~~~~~~~~~~~~~~~~~~~
  res <- unlist(res, recursive = FALSE)
  res
}


#~~~~~~~~~~~~~~~~~~~~~~~~~~~~~~~~~~~~~~~~~~~~~~~~~~~~~~~~~~~~~~~~~~~~~~~~~~~~~
# What are all the aesthetics for 'geom_point'?
#~~~~~~~~~~~~~~~~~~~~~~~~~~~~~~~~~~~~~~~~~~~~~~~~~~~~~~~~~~~~~~~~~~~~~~~~~~~~~
aesthetics <- list(
  required_aes = c("x", "y"),
  optional_aes = list(
    shape  = 19,
    colour = "black",
    size   = 1.5,
    fill   = NA,
    alpha  = NA,
    stroke = 0.5
  )
)

#~~~~~~~~~~~~~~~~~~~~~~~~~~~~~~~~~~~~~~~~~~~~~~~~~~~~~~~~~~~~~~~~~~~~~~~~~~~~~
# Going to drop some aesthetics from consideration
#~~~~~~~~~~~~~~~~~~~~~~~~~~~~~~~~~~~~~~~~~~~~~~~~~~~~~~~~~~~~~~~~~~~~~~~~~~~~~
aesthetics$optional_aes$fill   <- NULL
aesthetics$optional_aes$stroke <- NULL
aesthetics$optional_aes$alpha  <- NULL


#~~~~~~~~~~~~~~~~~~~~~~~~~~~~~~~~~~~~~~~~~~~~~~~~~~~~~~~~~~~~~~~~~~~~~~~~~~~~~
# What are the aesthetic names?
#~~~~~~~~~~~~~~~~~~~~~~~~~~~~~~~~~~~~~~~~~~~~~~~~~~~~~~~~~~~~~~~~~~~~~~~~~~~~~
aes_names <- c(aesthetics$required_aes, names(aesthetics$optional_aes))


#~~~~~~~~~~~~~~~~~~~~~~~~~~~~~~~~~~~~~~~~~~~~~~~~~~~~~~~~~~~~~~~~~~~~~~~~~~~~~
# How many aesthetics must we map to in total?
#~~~~~~~~~~~~~~~~~~~~~~~~~~~~~~~~~~~~~~~~~~~~~~~~~~~~~~~~~~~~~~~~~~~~~~~~~~~~~
aesthetics$N <- length(aesthetics$required_aes) + length(aesthetics$optional_aes)


#~~~~~~~~~~~~~~~~~~~~~~~~~~~~~~~~~~~~~~~~~~~~~~~~~~~~~~~~~~~~~~~~~~~~~~~~~~~~~
# Create all the possible variable-aesthetic mappings
#~~~~~~~~~~~~~~~~~~~~~~~~~~~~~~~~~~~~~~~~~~~~~~~~~~~~~~~~~~~~~~~~~~~~~~~~~~~~~
combos <- assign_vars(cols = all_vars, aesthetics = aesthetics)


#~~~~~~~~~~~~~~~~~~~~~~~~~~~~~~~~~~~~~~~~~~~~~~~~~~~~~~~~~~~~~~~~~~~~~~~~~~~~~
# Post-filtering to keep only combos where shape is a categorical variable
#~~~~~~~~~~~~~~~~~~~~~~~~~~~~~~~~~~~~~~~~~~~~~~~~~~~~~~~~~~~~~~~~~~~~~~~~~~~~~
combos <- combos %>%
  keep(~.x[3] == 'na' || .x[3] %in% cat_vars)

aes_names
[1] "x" "y" "shape" "colour" "size" head(combos)[[1]]
[1] "mpg" "cyl" "vs" "disp" "hp"
[[2]]
[1] "mpg" "cyl" "vs" "disp" "drat"
[[3]]
[1] "mpg" "cyl" "vs" "disp" "wt"
[[4]]
[1] "mpg" "cyl" "vs" "disp" "qsec"
[[5]]
[1] "mpg" "cyl" "vs" "disp" "am"
[[6]]
[1] "mpg" "cyl" "vs" "disp" "gear"length(combos)[1] 32850Create/save a plot using a particular variable-aesthetic mapping
#~~~~~~~~~~~~~~~~~~~~~~~~~~~~~~~~~~~~~~~~~~~~~~~~~~~~~~~~~~~~~~~~~~~~~~~~~~~~~
# Given an argument 'combo' and a vector of the aesthetic names,
# create an argument suitable for 'aes()' in a ggplot
#~~~~~~~~~~~~~~~~~~~~~~~~~~~~~~~~~~~~~~~~~~~~~~~~~~~~~~~~~~~~~~~~~~~~~~~~~~~~~
create_aes_args <- function(combo, aes_names) {
  combo %>%
    set_names(aes_names) %>%
    discard(~.x == '.na') %>%
    map(as.name)
}

#~~~~~~~~~~~~~~~~~~~~~~~~~~~~~~~~~~~~~~~~~~~~~~~~~~~~~~~~~~~~~~~~~~~~~~~~~~~~~
# Given an argument 'combo' and a vector of the aesthetic names,
# create (and execute) an 'aes()' call to create an mapping object for ggplot
#~~~~~~~~~~~~~~~~~~~~~~~~~~~~~~~~~~~~~~~~~~~~~~~~~~~~~~~~~~~~~~~~~~~~~~~~~~~~~
create_aes <- function(combo, aes_names) {
  aes_args <- create_aes_args(combo, aes_names)
  do.call('aes', aes_args)
}


#~~~~~~~~~~~~~~~~~~~~~~~~~~~~~~~~~~~~~~~~~~~~~~~~~~~~~~~~~~~~~~~~~~~~~~~~~~~~~
# Plot a single combo
#~~~~~~~~~~~~~~~~~~~~~~~~~~~~~~~~~~~~~~~~~~~~~~~~~~~~~~~~~~~~~~~~~~~~~~~~~~~~~
plot_combo <- function(idx) {
  combo    <- combos[[idx]]
  this_aes <- create_aes(combo, aes_names)

  aes_args <- create_aes_args(combo, aes_names)
  title    <- paste(names(aes_args), unname(aes_args), sep = ":", collapse = ", ")

  ggplot(plot_df) +
    geom_point(mapping = this_aes) +
    theme_bw() +
    labs(title = title) +
    theme(
      legend.position = 'none',
      axis.text       = element_blank(),
      axis.ticks      = element_blank(),
      axis.title      = element_blank(),
      panel.grid      = element_blank(),
      panel.border    = element_blank()
    )
}

#~~~~~~~~~~~~~~~~~~~~~~~~~~~~~~~~~~~~~~~~~~~~~~~~~~~~~~~~~~~~~~~~~~~~~~~~~~~~~
# Save a single combo to file
#~~~~~~~~~~~~~~~~~~~~~~~~~~~~~~~~~~~~~~~~~~~~~~~~~~~~~~~~~~~~~~~~~~~~~~~~~~~~~
save_combo <- function(idx) {
  p <- plot_combo(idx)
  filename <- file.path("everyplot", sprintf("%05i.png", idx))
  ggsave(filename = filename, plot = p, width = 4, height = 3)
}
Save a sample of the 32,850 plot combinations
set.seed(1)
idxs <- sample(length(combos), size = 10*96)

idxs %>% walk(save_combo)

# ImageMagick from the commandline
# montage *.png -tile 8x12 -geometry 400x250 -define png:format=png32 -dither None -colors 16 -depth 4 out/out.png