ggreverse
![]()
![]()
ggreverse takes a ggplot object and returns the code to create that plot.
This package was written as a learning exercise to help me figure out some of the internal structure of a ggplot object.
ToDo
- Reverse engineering of facetting and scales from a plot object.
aes_string()is currently unsupported.- Using tidyeval in
aes()calls is currently unsupported. - Lots of other stuff :)
Installation
You can install from GitHub with:
# install.packages("remotes")
remotes::install_github("coolbutuseless/ggreverse")
Example ggreverse::convert_to_code()
- Create a ggplot
- Convert the ggplot back into code using
ggreverse - Convert the code back into a plot
library(ggreverse)

plot_df <- mtcars

# Create a ggplot2 plot object
p <- ggplot(plot_df) +
  geom_point(aes(mpg, wt), size = 3) +
  labs(title = "hello") +
  theme_bw() +
  coord_equal()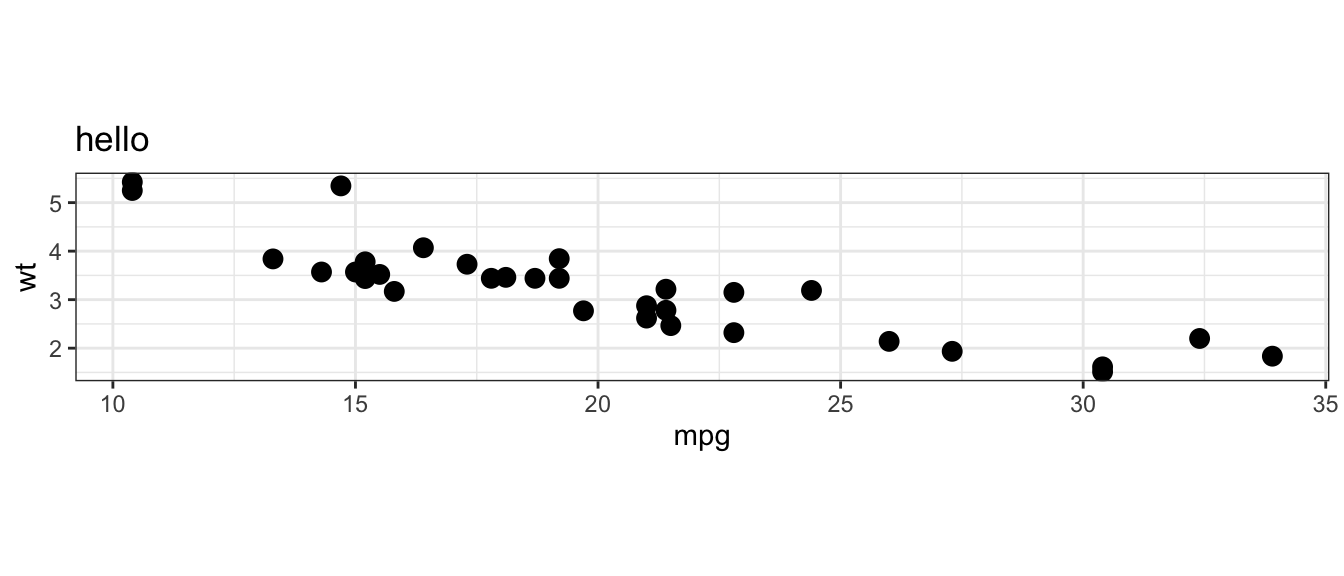
# Convert the plot object back into code
plot_code <- ggreverse::convert_to_code(p)
plot_code
Warning: Could not use colored = TRUE, as the package prettycode is not
installed. Please install it if you want to see colored output or see `?
print.vertical` for more information.ggplot(data = plot_df) +
geom_point(mapping = aes(x = mpg, y = wt), size = 3, position = position_identity(), stat = "identity") +
labs(title = "hello", x = "mpg", y = "wt") +
theme_bw(11) +
coord_fixed()# Parse the plot code back into a plot - which should match the original plot
eval(parse(text = plot_code))
SessionInfo
Developed against:
- R 3.5.3
- ggplot2 v3.1.1