Idea
tjmahr posted a neat hack to embed auto-embed the text used to create a ggplot as the title of the plot itself.
I wondered if you could somehow extract the ggplot call text from a ggplot object itself.
Proof-of-concept: Reverse engineering a ggplot call
library(ggplot2)
library(dplyr)

#~~~~~~~~~~~~~~~~~~~~~~~~~~~~~~~~~~~~~~~~~~~~~~~~~~~~~~~~~~~~~~~~~~~~~~~~~~~~~~
# reverse_mapping ->  "aes(x = ..., y = ...)"
#~~~~~~~~~~~~~~~~~~~~~~~~~~~~~~~~~~~~~~~~~~~~~~~~~~~~~~~~~~~~~~~~~~~~~~~~~~~~~~
reverse_mapping <- function(mapping) {
  aes_args <- paste(names(mapping), stringr::str_sub(as.character(mapping), start=2), sep = "=", collapse = ", ")
  aes_text <- glue::glue("aes({aes_args})")
  aes_text
}


#~~~~~~~~~~~~~~~~~~~~~~~~~~~~~~~~~~~~~~~~~~~~~~~~~~~~~~~~~~~~~~~~~~~~~~~~~~~~~~
# reverse aesthetic params ->  "size = 3"
#~~~~~~~~~~~~~~~~~~~~~~~~~~~~~~~~~~~~~~~~~~~~~~~~~~~~~~~~~~~~~~~~~~~~~~~~~~~~~~
reverse_aes_params <- function(aes_params) {
  if (length(aes_params) == 0) {
    NULL
  } else {
    paste(names(aes_params), unname(aes_params), sep = "=", collapse = ", ")
  }
}


#~~~~~~~~~~~~~~~~~~~~~~~~~~~~~~~~~~~~~~~~~~~~~~~~~~~~~~~~~~~~~~~~~~~~~~~~~~~~~~
# reverse_layer -> "geom_point(aes(mpg, wt), size = 3)"
#~~~~~~~~~~~~~~~~~~~~~~~~~~~~~~~~~~~~~~~~~~~~~~~~~~~~~~~~~~~~~~~~~~~~~~~~~~~~~~
reverse_layer <- function(layer) {
  geom_name <- ggplot2:::snakeize(class(layer$geom)[1])

  aes_text        <- reverse_mapping(layer$mapping)
  aes_params_text <- reverse_aes_params(layer$aes_params)
  geom_args <- paste(c(aes_text, aes_params_text), collapse = ", ")


  glue::glue("{geom_name}({geom_args})")
}


#~~~~~~~~~~~~~~~~~~~~~~~~~~~~~~~~~~~~~~~~~~~~~~~~~~~~~~~~~~~~~~~~~~~~~~~~~~~~~~
# Reverse plot
#~~~~~~~~~~~~~~~~~~~~~~~~~~~~~~~~~~~~~~~~~~~~~~~~~~~~~~~~~~~~~~~~~~~~~~~~~~~~~~
reverse_plot <- function(p) {
  layers <- p$layers %>% map_chr(reverse_layer)

  plot_text <- paste(c("ggplot(data)", layers), collapse = "+\n")
  styler::style_text(plot_text)
}
Example
#~~~~~~~~~~~~~~~~~~~~~~~~~~~~~~~~~~~~~~~~~~~~~~~~~~~~~~~~~~~~~~~~~~~~~~~~~~~~~~
# Create a plot object
#~~~~~~~~~~~~~~~~~~~~~~~~~~~~~~~~~~~~~~~~~~~~~~~~~~~~~~~~~~~~~~~~~~~~~~~~~~~~~~
(p <- ggplot(mtcars) +
  geom_point(aes(mpg, wt), size = 3) +
  geom_line(aes(mpg, wt)))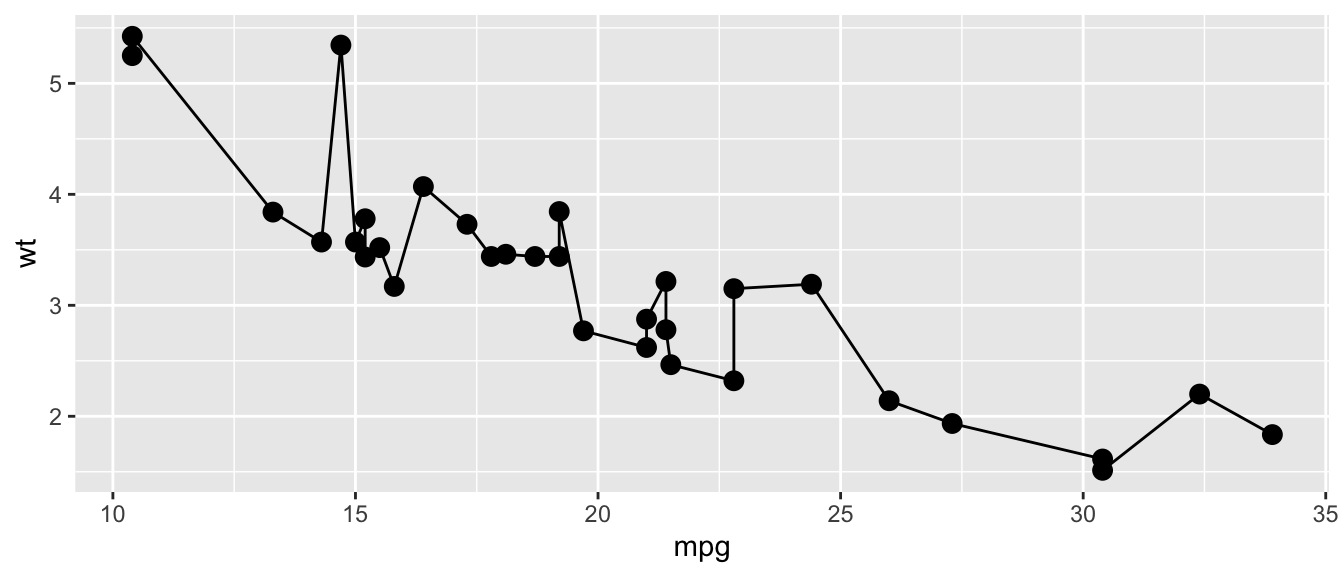
#~~~~~~~~~~~~~~~~~~~~~~~~~~~~~~~~~~~~~~~~~~~~~~~~~~~~~~~~~~~~~~~~~~~~~~~~~~~~~~
# Determine the ggplot call from the ggplot object
#~~~~~~~~~~~~~~~~~~~~~~~~~~~~~~~~~~~~~~~~~~~~~~~~~~~~~~~~~~~~~~~~~~~~~~~~~~~~~~
reverse_plot(p)
Warning: Could not use colored = TRUE, as the package prettycode is not
installed. Please install it if you want to see colored output or see `?
print.vertical` for more information.ggplot(data) +
geom_point(aes(x = mpg, y = wt), size = 3) +
geom_line(aes(x = mpg, y = wt))