grid graphics in R
grid graphics is one of the graphics systems within R - ggplot and trellis are both built upon the grid system.
This is some exploratory code to figure out some of the capabilities of grid, by using
it to draw fractals using L-systems.
Rather than simply calculating and drawing lines, I am interested in how viewports
in the grid system work. So to draw L-systems, the movement and rotation of lines
are carried out by pushing new viewports on the viewing stack.
L-systems
L-systems are a means of generating strings from other strings (see wikipedia).
When these strings are interpreted as drawing instructions, they can make some great looking fractals.
There are some really nice examples of L-system output (using R) on aschinchon’s blog
L-system Expansion
The following function will expand an L-system given its axiom and production rules.
#~~~~~~~~~~~~~~~~~~~~~~~~~~~~~~~~~~~~~~~~~~~~~~~~~~~~~~~~~~~~~~~~~~~~~~~~~~~~~
#' Expand an L-system
#'
#' @param axiom l-system axiom (vector of characters)
#' @param rules list of expansion rules
#' @param depth number of iterations
#'
#' @return vector of characters representing the expanded l-system
#~~~~~~~~~~~~~~~~~~~~~~~~~~~~~~~~~~~~~~~~~~~~~~~~~~~~~~~~~~~~~~~~~~~~~~~~~~~~~
expand_system <- function(axiom, rules, depth) {
  string <- axiom
  for (i in seq_len(depth)) {
    string <- map(string, ~rules[[.x]] %||% .x) %>%
      flatten_chr()
  }
  string
}
Sierpinski L-system: Axiom, Rules and drawing/viewport functions
See wikipedia for the background on this L-system.
Summary:
- Start with the string `F-G-G’
- At every iteration:
- Replace
FbyF-G+F+G-F - Replace
GbyGG
- Replace
- When drawing:
FandGmean ‘move forward’+/-mean to ‘rotate right/left’
#~~~~~~~~~~~~~~~~~~~~~~~~~~~~~~~~~~~~~~~~~~~~~~~~~~~~~~~~~~~~~~~~~~~~~~~~~~~~~
# Sierpinski
# - axiom and rules
# - Reference: https://en.wikipedia.org/wiki/L-system
#~~~~~~~~~~~~~~~~~~~~~~~~~~~~~~~~~~~~~~~~~~~~~~~~~~~~~~~~~~~~~~~~~~~~~~~~~~~~~
axiom <- strsplit('F-G-G', '')[[1]]
rules <- list(
'F' = el(strsplit('F-G+F+G-F', '')),
'G' = el(strsplit('GG' , ''))
)
#~~~~~~~~~~~~~~~~~~~~~~~~~~~~~~~~~~~~~~~~~~~~~~~~~~~~~~~~~~~~~~~~~~~~~~~~~~~~~
# Move forward
# - Draw a line in the current viewport
# - advance a viewport to the end of this line
#~~~~~~~~~~~~~~~~~~~~~~~~~~~~~~~~~~~~~~~~~~~~~~~~~~~~~~~~~~~~~~~~~~~~~~~~~~~~~
forward <- function() {
grid.lines(x = c(0.5, 0.5), y = c(0, length))
pushViewport(
viewport(x = 0.5, y = length, clip = 'off', just = c('centre', 'bottom')),
recording = FALSE
)
invisible()
}
#~~~~~~~~~~~~~~~~~~~~~~~~~~~~~~~~~~~~~~~~~~~~~~~~~~~~~~~~~~~~~~~~~~~~~~~~~~~~~
# '+'
# - push a viewport which is rotated right 120 degrees
#~~~~~~~~~~~~~~~~~~~~~~~~~~~~~~~~~~~~~~~~~~~~~~~~~~~~~~~~~~~~~~~~~~~~~~~~~~~~~
rotate_right <- function() {
pushViewport(
viewport(angle = 120, clip = 'off', x = 0.5, y = 0, just = c('centre', 'bottom')),
recording = FALSE
)
}
#~~~~~~~~~~~~~~~~~~~~~~~~~~~~~~~~~~~~~~~~~~~~~~~~~~~~~~~~~~~~~~~~~~~~~~~~~~~~~
# '-'
# - push a viewport which is rotated left 120 degrees
#~~~~~~~~~~~~~~~~~~~~~~~~~~~~~~~~~~~~~~~~~~~~~~~~~~~~~~~~~~~~~~~~~~~~~~~~~~~~~
rotate_left <- function() {
pushViewport(
viewport(angle = -120, clip = 'off', x = 0.5, y = 0, just = c('centre', 'bottom')),
recording = FALSE
)
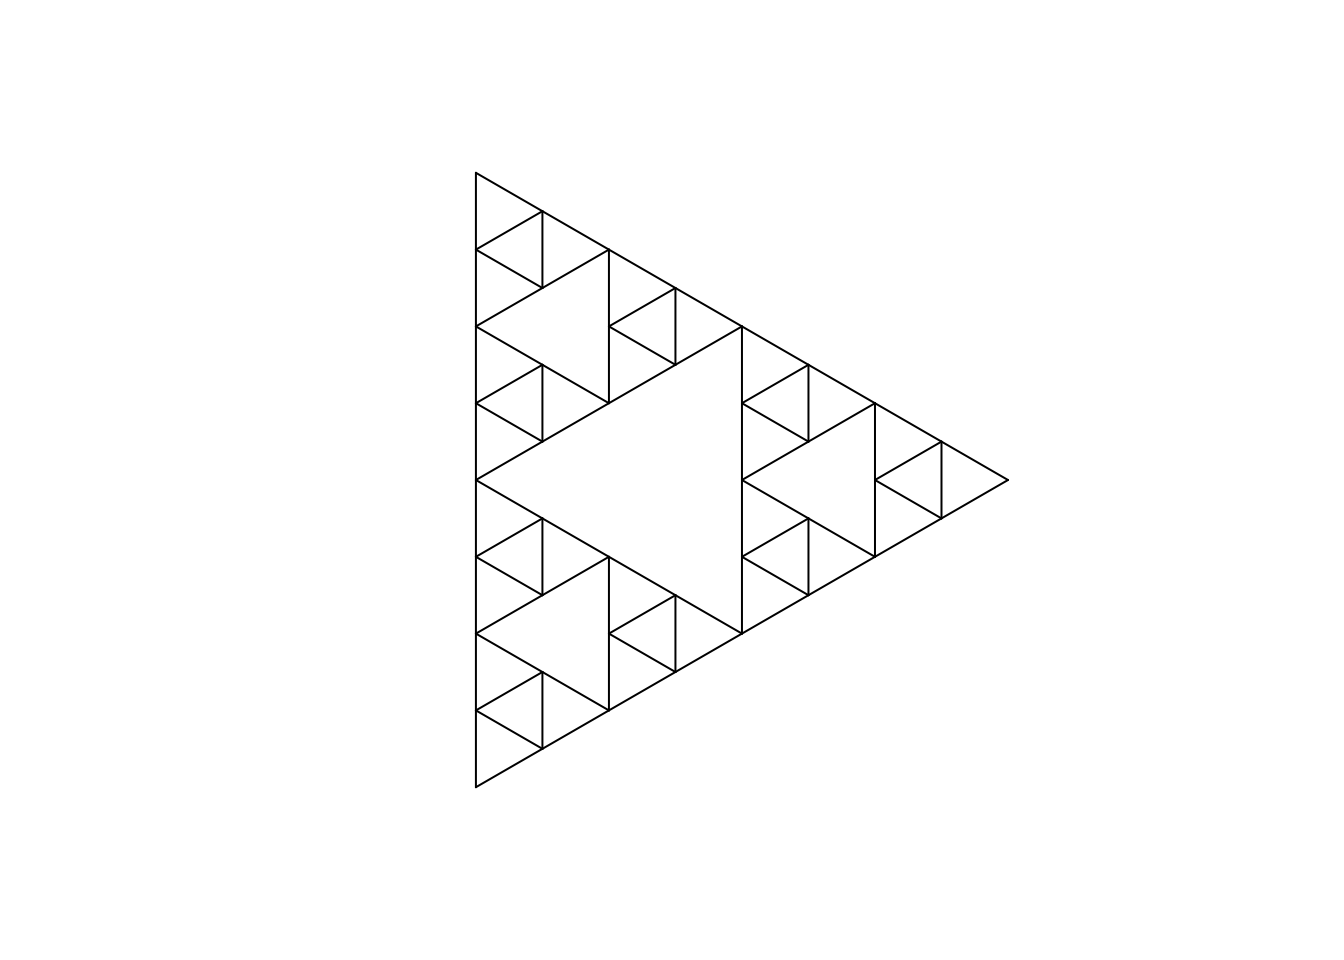
}Render the Sierpinski L-system at depth = 3
#~~~~~~~~~~~~~~~~~~~~~~~~~~~~~~~~~~~~~~~~~~~~~~~~~~~~~~~~~~~~~~~~~~~~~~~~~~~~~
# Sizing of elements depends on how deep we go
#~~~~~~~~~~~~~~~~~~~~~~~~~~~~~~~~~~~~~~~~~~~~~~~~~~~~~~~~~~~~~~~~~~~~~~~~~~~~~
depth <- 3
length <- c(0.32, 0.16, 0.08, 0.04, 0.02, 0.01)[depth]

#~~~~~~~~~~~~~~~~~~~~~~~~~~~~~~~~~~~~~~~~~~~~~~~~~~~~~~~~~~~~~~~~~~~~~~~~~~~~~
# Expand the L-system
#~~~~~~~~~~~~~~~~~~~~~~~~~~~~~~~~~~~~~~~~~~~~~~~~~~~~~~~~~~~~~~~~~~~~~~~~~~~~~
string <- expand_system(axiom, rules, depth = depth)
cat(paste(string, collapse = ""))F-G+F+G-F-GG+F-G+F+G-F+GG-F-G+F+G-F-GGGG+F-G+F+G-F-GG+F-G+F+G-F+GG-F-G+F+G-F+GGGG-F-G+F+G-F-GG+F-G+F+G-F+GG-F-G+F+G-F-GGGGGGGG-GGGGGGGG#~~~~~~~~~~~~~~~~~~~~~~~~~~~~~~~~~~~~~~~~~~~~~~~~~~~~~~~~~~~~~~~~~~~~~~~~~~~~~
# Set up a new grid page in a pleasing orientation
#~~~~~~~~~~~~~~~~~~~~~~~~~~~~~~~~~~~~~~~~~~~~~~~~~~~~~~~~~~~~~~~~~~~~~~~~~~~~~
grid.newpage()
pushViewport(viewport(x=0.75, y=0.5, just = c('centre', 'bottom'), angle = 120))
#~~~~~~~~~~~~~~~~~~~~~~~~~~~~~~~~~~~~~~~~~~~~~~~~~~~~~~~~~~~~~~~~~~~~~~~~~~~~~
# For each rule in the L-system string, following the rules to
# maniuplate the viewport and draw the lines
#~~~~~~~~~~~~~~~~~~~~~~~~~~~~~~~~~~~~~~~~~~~~~~~~~~~~~~~~~~~~~~~~~~~~~~~~~~~~~
for (i in seq_along(string)) {
symbol <- string[i]
# cat(i, symbol, "\n")
switch(
symbol,
'F' = forward(),
'G' = forward(),
'+' = rotate_right(),
'-' = rotate_left()
)
}
Animated Sierpinski L-System - by draw step
An animation showing the drawing process evolve for depth = 2
[1] "F-G+F+G-F-GG+F-G+F+G-F+GG-F-G+F+G-F-GGGG-GGGG"
Animated Sierpinski L-System - by draw step
An animation showing the drawing process evolve for depth = 5
Animated Sierpinski L-System - by depth
This gif was created by rendering the L-system at multiple depths and combining individual images into a gif.
Future
- Rendering other L-systems with grid graphics