devoutaudio 
![]()
![]()
![]()
devoutaudio is an audio output “graphics” device - instead of rendering pixels,
each graphics primitive is rendered as an audio snippet.
This is a testing ground for some graphics-to-sound ideas and is very experimental.
devoutaudio is written in plain R, and uses the
devout package to interface with the
R internals
Point-to-sound mapping
- x position is mapped to audio channel position - points on the left of the plot are rendered mainly in the left channel of audio
- y position is mapped to frequency - the higher the point the higher the frequency
- size is mapped to duration - larger points have a longer sound
Installation
You can install devoutaudio from GitHub with:
# install.packages("devtools")
devtools::install_github("coolbutuseless/devout")
devtools::install_github("coolbutuseless/devoutaudio")
Caveats
- This is a very experimental device.
- Only circles are currently mapped to a sound
- Audio is only played on-the-fly and there is no facility to save yet.
Examples
In the following examples:
- only audio is produced by the code show, but I’ve included the visual representation of the plots to assist in interpreting the audio
- because the audio is never saved to file, the audio was captured on-the-fly from the MacOS sound output device
Example 1
library(devoutaudio)

audio()
plot(1:10)
dev.off()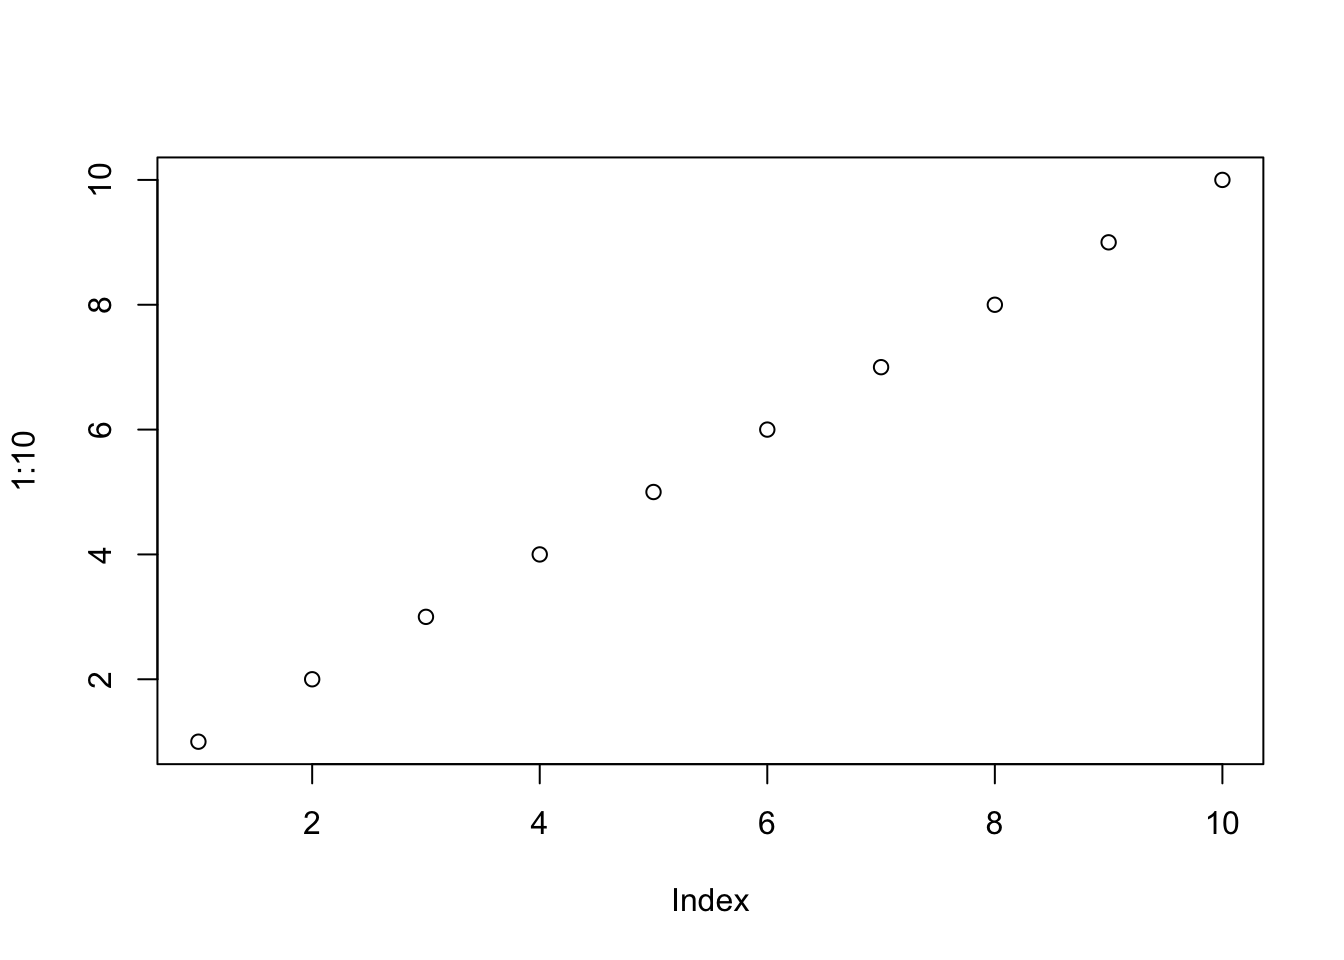
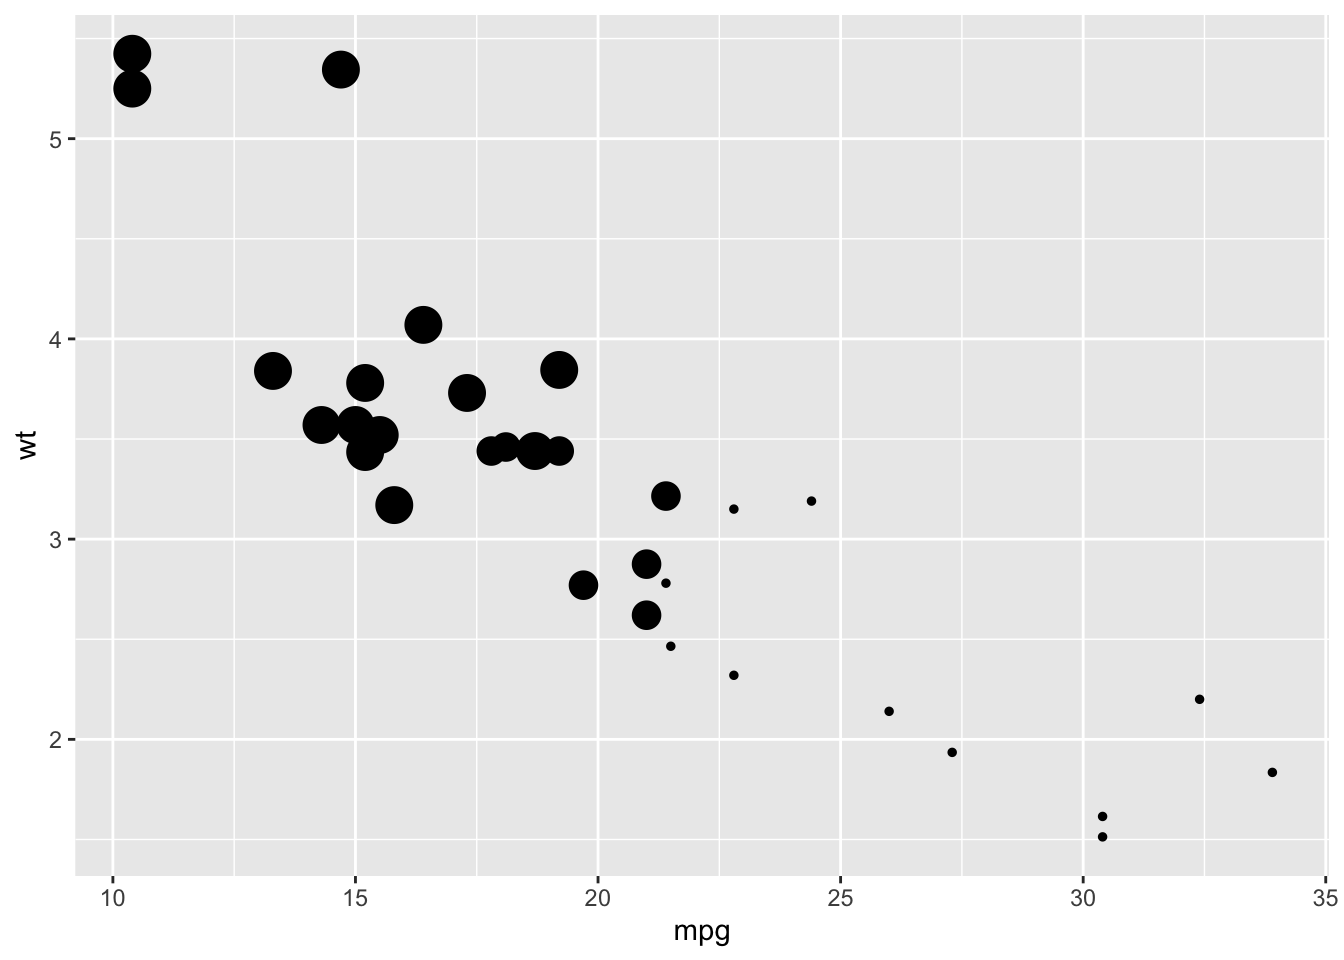
Example 2
plot_df <- mtcars %>% arrange(mpg)

audio()
ggplot(plot_df) +
  geom_point(aes(mpg, wt, size = cyl)) +
  theme(legend.position = 'none')
dev.off()