devoutpdf 


devoutpdf is a hand-crafted PDF graphics device written in plain R.
It achieves this by invoking the devout
package to do all the interfacing between the C++ side and the R side.
Drawing commands which sent to the graphics
device are used to construct a minipdf document.
Why would you want this?
Given that pdf() and cairo_pdf() devices come with R, what’s the point of
a third PDF output device?
- Hacking your own graphics device gives a significant amount of control over the actual output
- You can learn how a graphics device works - it’s just R, so there’s no C++ code to sift through.
- Use as a template to write your own graphics device for something bespoke e.g. pen plotter output or a laser projection driver!
- Glitch the output at the device level e.g. for each line, perhaps draw multiple overlapping lines with randomly jittered endpoints to simulate a ‘pencil sketch’ effect.
The R code
The R code for this device is a single file about 300 lines long - most of which is whitespace and comments. Check it out on github
ToDo
- Helvetica font is currently used regardless of what the user specifies. This
is a deficiency that first needs to be fixed in
minipdf.
Installation
You can install from GitHub with:
# install.packages("devtools")
devtools::install_github("coolbutuseless/devout")    # graphics device shim
devtools::install_github("coolbutuseless/minipdf")   # PDF document builder
devtools::install_github("coolbutuseless/devoutpdf") # Devout PDF graphics device
Example: ggplot scatterplot
devoutpdf::pdfout(filename = "/img/devoutpdf/test1.pdf", width=5, height=4)
ggplot(mtcars) +
  geom_point(aes(mpg, wt)) +
  labs(title = "test1") +
  theme_bw()
invisible(dev.off())
Example: ggplot bar plot
devoutpdf::pdfout(filename = "/img/devoutpdf/test2.pdf", width = 6, height = 4)
ggplot(mtcars) +
  geom_bar(aes(as.factor(cyl), fill = as.factor(cyl))) +
  labs(title = "test2")
invisible(dev.off())
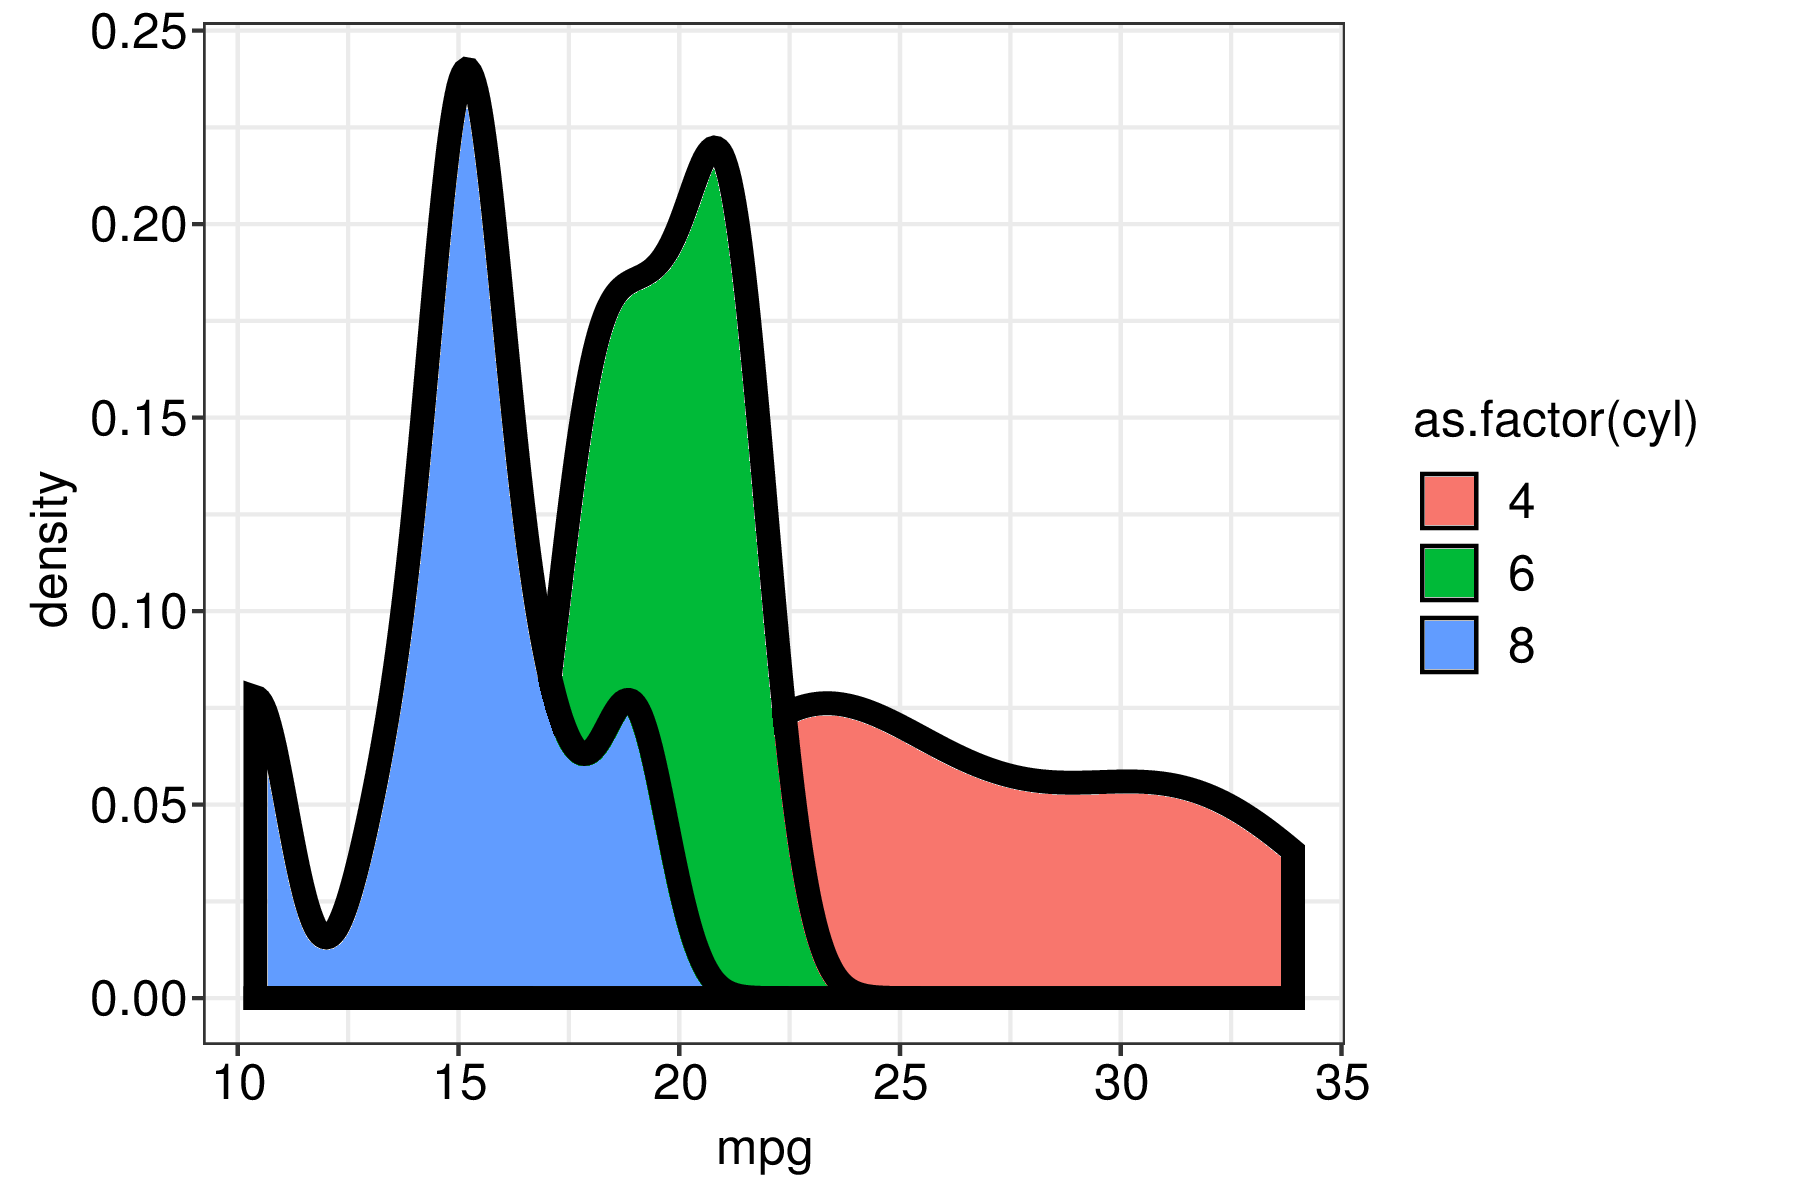
Example: ggplot density plot
devoutpdf::pdfout(filename = "/img/devoutpdf/test3.pdf", width = 6, height = 4)
ggplot(mtcars) +
  geom_density(aes(mpg, fill = as.factor(cyl)), alpha = 1, size = 2) +
  theme_bw()
invisible(dev.off())
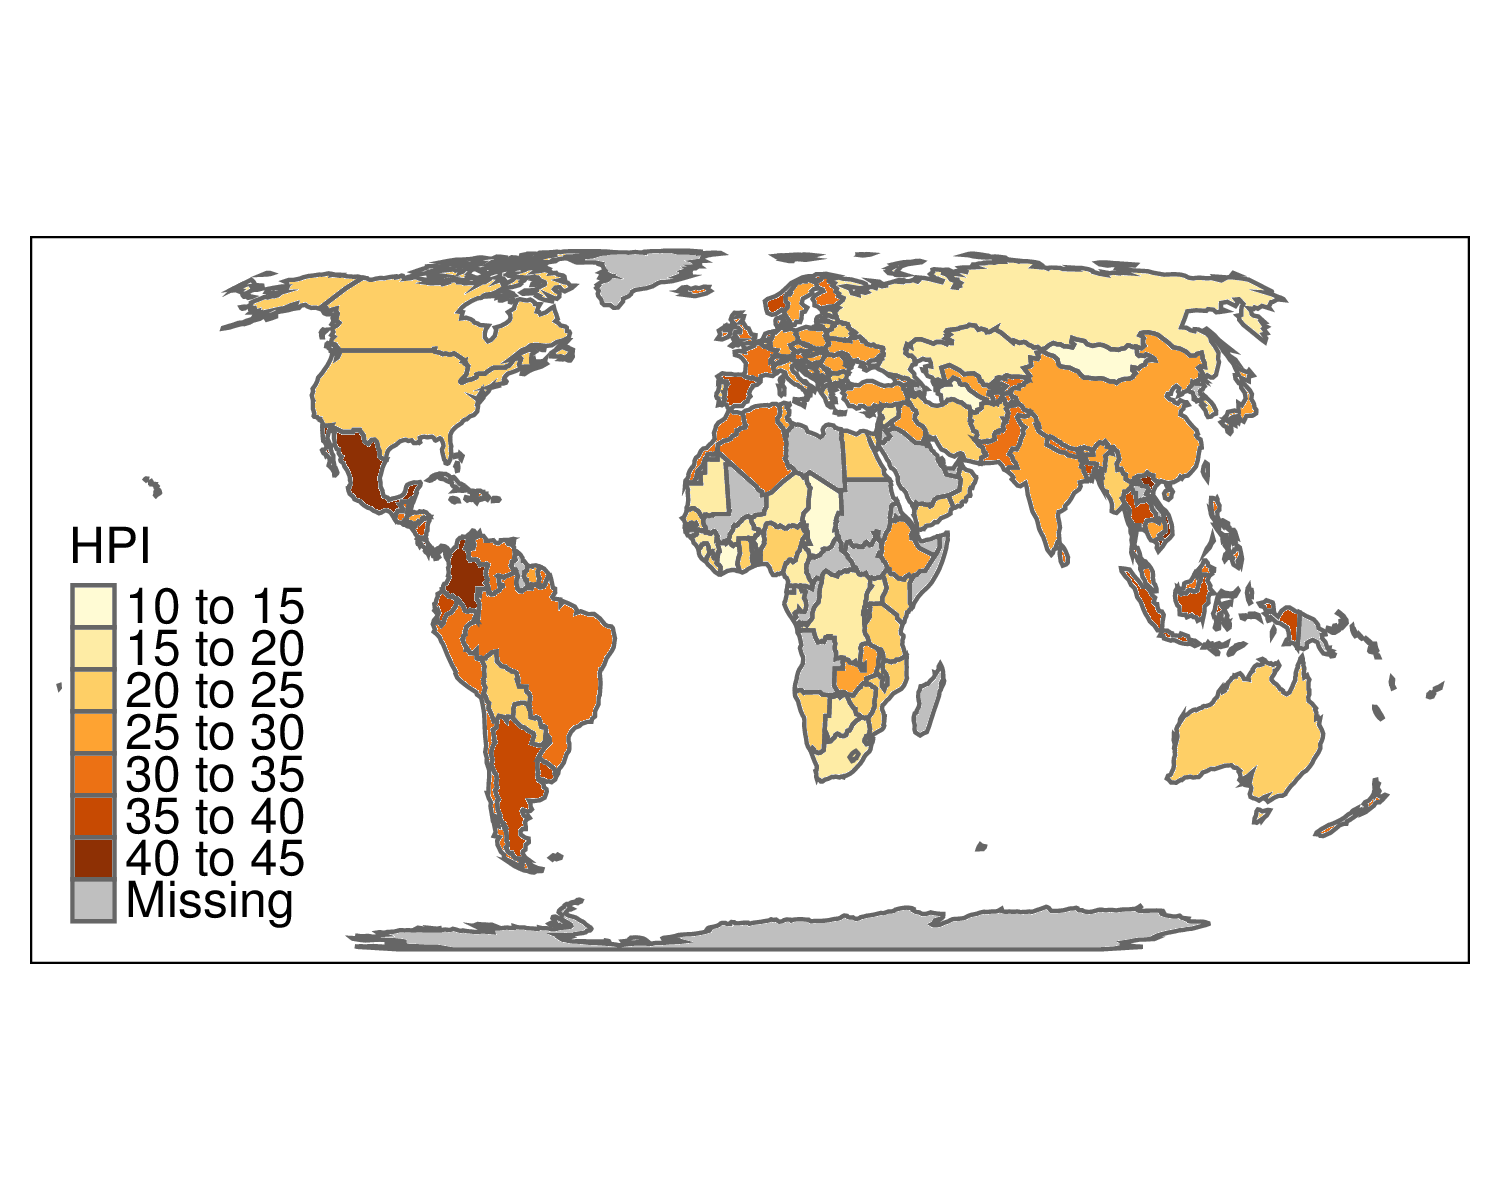
Example: tmap world plot
library(tmap)
data("World")

devoutpdf::pdfout(filename = "/img/devoutpdf/test4.pdf", width = 5, height = 4)
tm_shape(World) +
    tm_polygons("HPI")
invisible(dev.off())
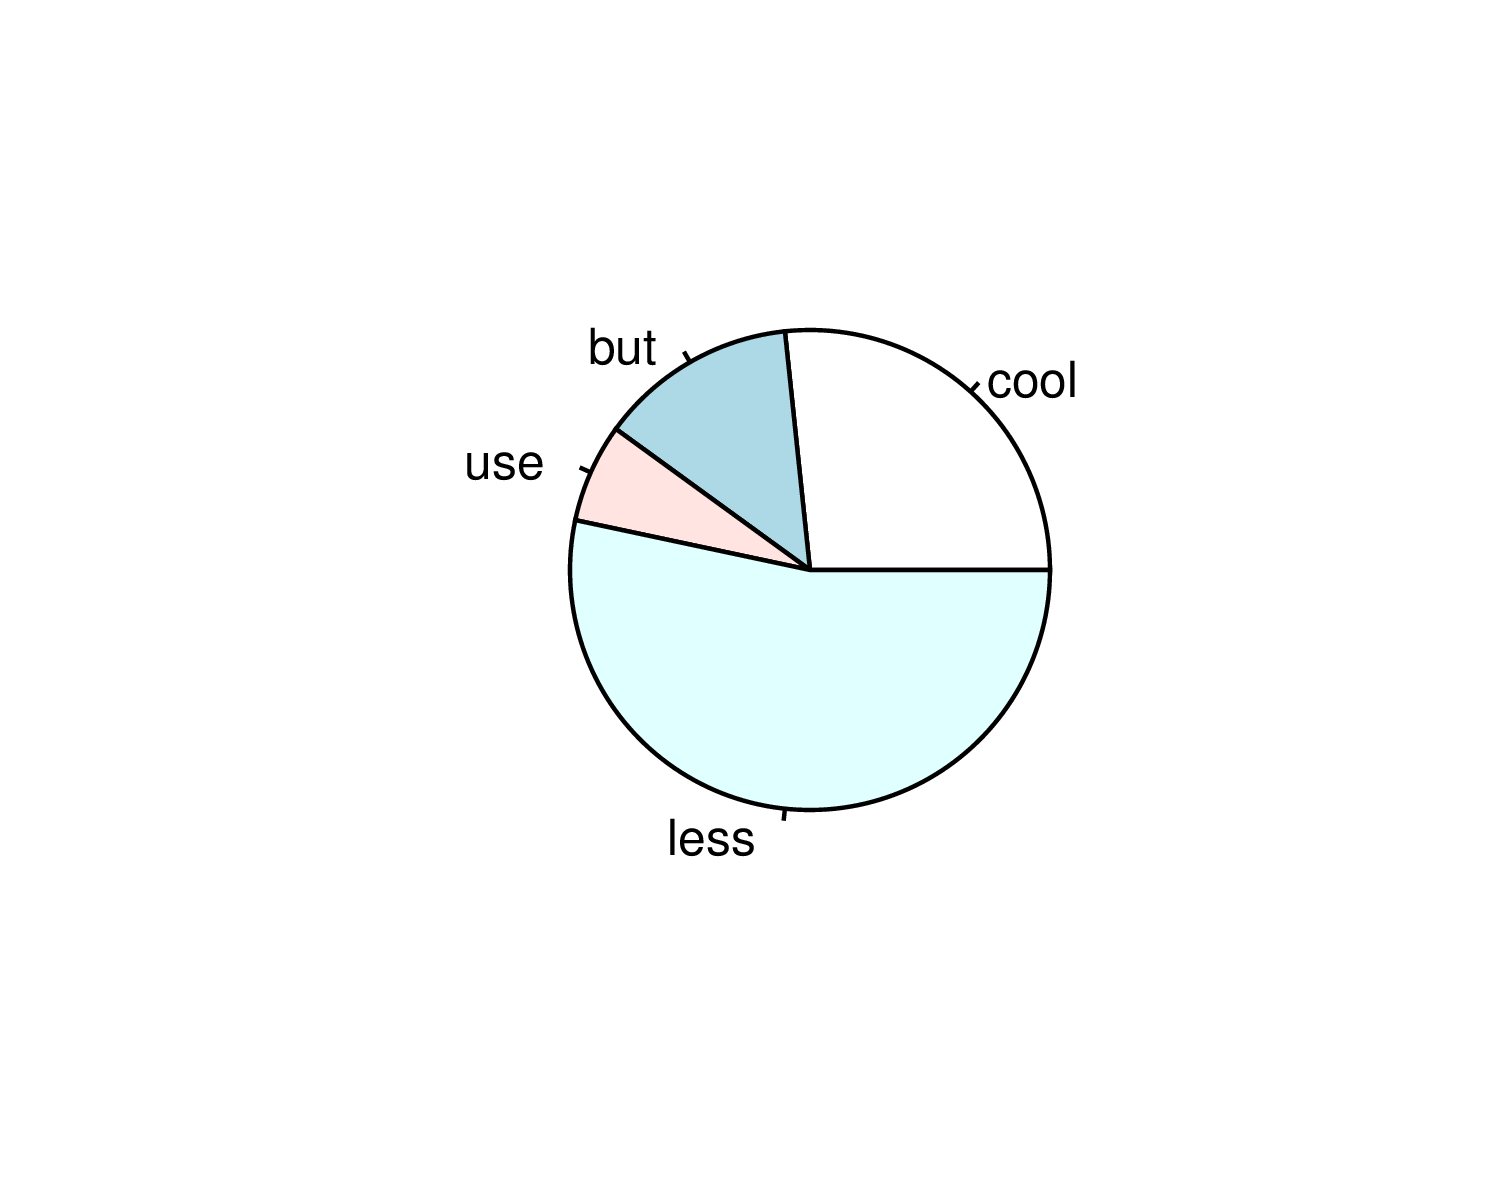
Example: base graphics pie chart
devoutpdf::pdfout(filename = "/img/devoutpdf/test5.pdf", width = 5, height = 4)
pie(c(cool = 4, but = 2, use = 1, less = 8))
invisible(dev.off())