My mental model of alpha when plotting
When plotting overlapping elements with a defined alpha (opacity), I had always thought about it as an additive process with results clamped to not exceed 1.
Thus, without every bothering to check, my mental model was: three overlapping black rectangles, each with an opacity of 0.4, would result in a black rectangle since their combined opacity is 1.2, and this is clamped the maximum possible value of 1.
My mental model is wrong.
What actually happens with overlapping alpha
In each sub-plot, I’ve plotted the overlap of a number of rectangles, each with opacity of 0.4.
The combined opacity increases with each overlap but doesn’t quite reach an opacity of 1.
#~~~~~~~~~~~~~~~~~~~~~~~~~~~~~~~~~~~~~~~~~~~~~~~~~~~~~~~~~~~~~~~~~~~~~~~~~~~~~~
# Simple function to create a plot with N overlapping rectangles with
# each having an alpha of 0.4
#~~~~~~~~~~~~~~~~~~~~~~~~~~~~~~~~~~~~~~~~~~~~~~~~~~~~~~~~~~~~~~~~~~~~~~~~~~~~~~
stack_alpha <- function(N) {
  plot_df <- tibble(
    x       = seq(0.45, 0.55, length.out = N),
    y       = seq(0.45, 0.55, length.out = N),
    opacity = 0.4
  )

  ggplot(plot_df) +
    geom_tile(aes(x, y, alpha = I(opacity)), fill = 'black',
              width=0.5, height = 0.5, colour = NA) +
    theme_void() +
    coord_equal()
}

plots <- lapply(1:4, stack_alpha)

patchwork::wrap_plots(plots, ncol = 4)
Correcting my thinking
Rather than talking about opacity, I should think in terms of transmissivity
(i.e. 1-opacity) - and transmissivity is a multiplicative property.
So, for a sequence of N layers with a transmissivity t, the transmissivity of the
result is t^N, and thus the opacity is (1 - t^N)
The following plots show the original 4 plots from above, and below them plots of my estimation of the combined alpha using multiplicative transmissivity
| N | opacity | transmissivity | cumulative transmissivity | cumulative alpha |
|---|---|---|---|---|
| 1 | 0.4 | 0.6 | 0.6 | 1 - 0.6 = 0.4 |
| 2 | 0.4 | 0.6 | 0.6 * 0.6 = 0.36 | 1 - 0.36 = 0.64 |
| 3 | 0.4 | 0.6 | 0.6 * 0.6 * 0.6 = 0.216 | 1 - 0.216 = 0.784 |
| 4 | 0.4 | 0.6 | 0.6 ^ 4 = 0.1296 | 1 - 0.1296 = 0.8704 |
#~~~~~~~~~~~~~~~~~~~~~~~~~~~~~~~~~~~~~~~~~~~~~~~~~~~~~~~~~~~~~~~~~~~~~~~~~~~~~~
# Manually calculate the total transmissivity for 1-4 overlapping rectangles.
#~~~~~~~~~~~~~~~~~~~~~~~~~~~~~~~~~~~~~~~~~~~~~~~~~~~~~~~~~~~~~~~~~~~~~~~~~~~~~~
manually_stack_alpha <- function(N) {
  plot_df <- tibble(
    N = N,
    x = 0.5,
    y = 0.5,
    tranmissivity = (1 - 0.4)^N,
    opacity       = 1 - tranmissivity
  )

  ggplot(plot_df) +
    geom_tile(aes(x, y, alpha = I(opacity)), fill = 'black',
              width=0.5, height = 0.5, colour = NA) +
    theme_void() +
    coord_equal() +
    facet_wrap(~N + opacity, labeller = label_both)
}


manual_plots <- lapply(1:4, manually_stack_alpha)

patchwork::wrap_plots(c(plots, manual_plots), ncol = 4)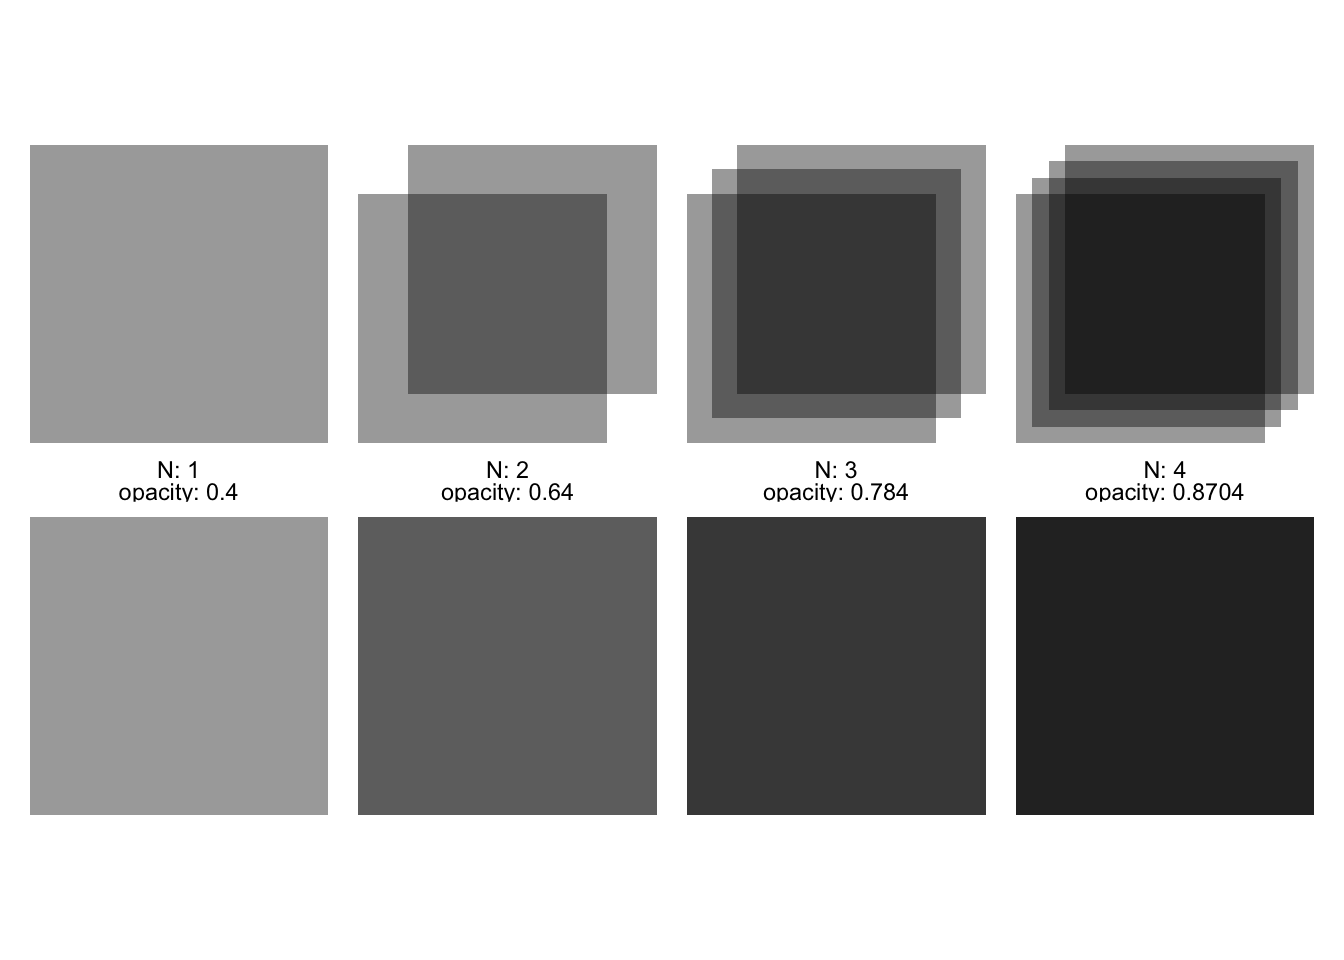
Summary
- Opacity isn’t additive.
- Transmissivity = 1 - Opacity.
- Transmissivity is multiplicative