devoutdrawio 


drawio is an open source web and desktop application for creating and editing structured
diagrams.
devoutdrawio is a new graphics output device for R which will output graphics
in the drawio XML format suitable for editing in drawio.
Why drawio?
drawio allows you to quickly edit structured documents online for free. By
outputting in a format suitable for drawio, you can output graphics from R
and then manually edit individual elements, lines and polygons to suite your
needs.
Installation
You can install from GitHub with:
# install.packages("remotes")
remotes::install_github("coolbutuseless/devout")       # devout framework
remotes::install_github("coolbutuseless/minidrawio")   # draw.io doc creator
remotes::install_github("coolbutuseless/devoutdrawio") # this device
Limitations
- No current support for clipping paths or rasters.
- Text positioning and spacing is still a little off
- Rotated text (except for 0 and 90 degrees) is probably going to be placed incorrectly.
- No code has been written to handle changes to the font family so you’re stuck with helvetica for now.
Basic Usage
Use devoutdrawio::drawio as you would the pdf() or png() device.
The output will be written to an XML file in the draw.io format.
You can then load this into the draw.io web app.
#~~~~~~~~~~~~~~~~~~~~~~~~~~~~~~~~~~~~~~~~~~~~~~~~~~~~~~~~~~~~~~~~~~~~~~~~~~~~~
# PNG output of plot
#~~~~~~~~~~~~~~~~~~~~~~~~~~~~~~~~~~~~~~~~~~~~~~~~~~~~~~~~~~~~~~~~~~~~~~~~~~~~~
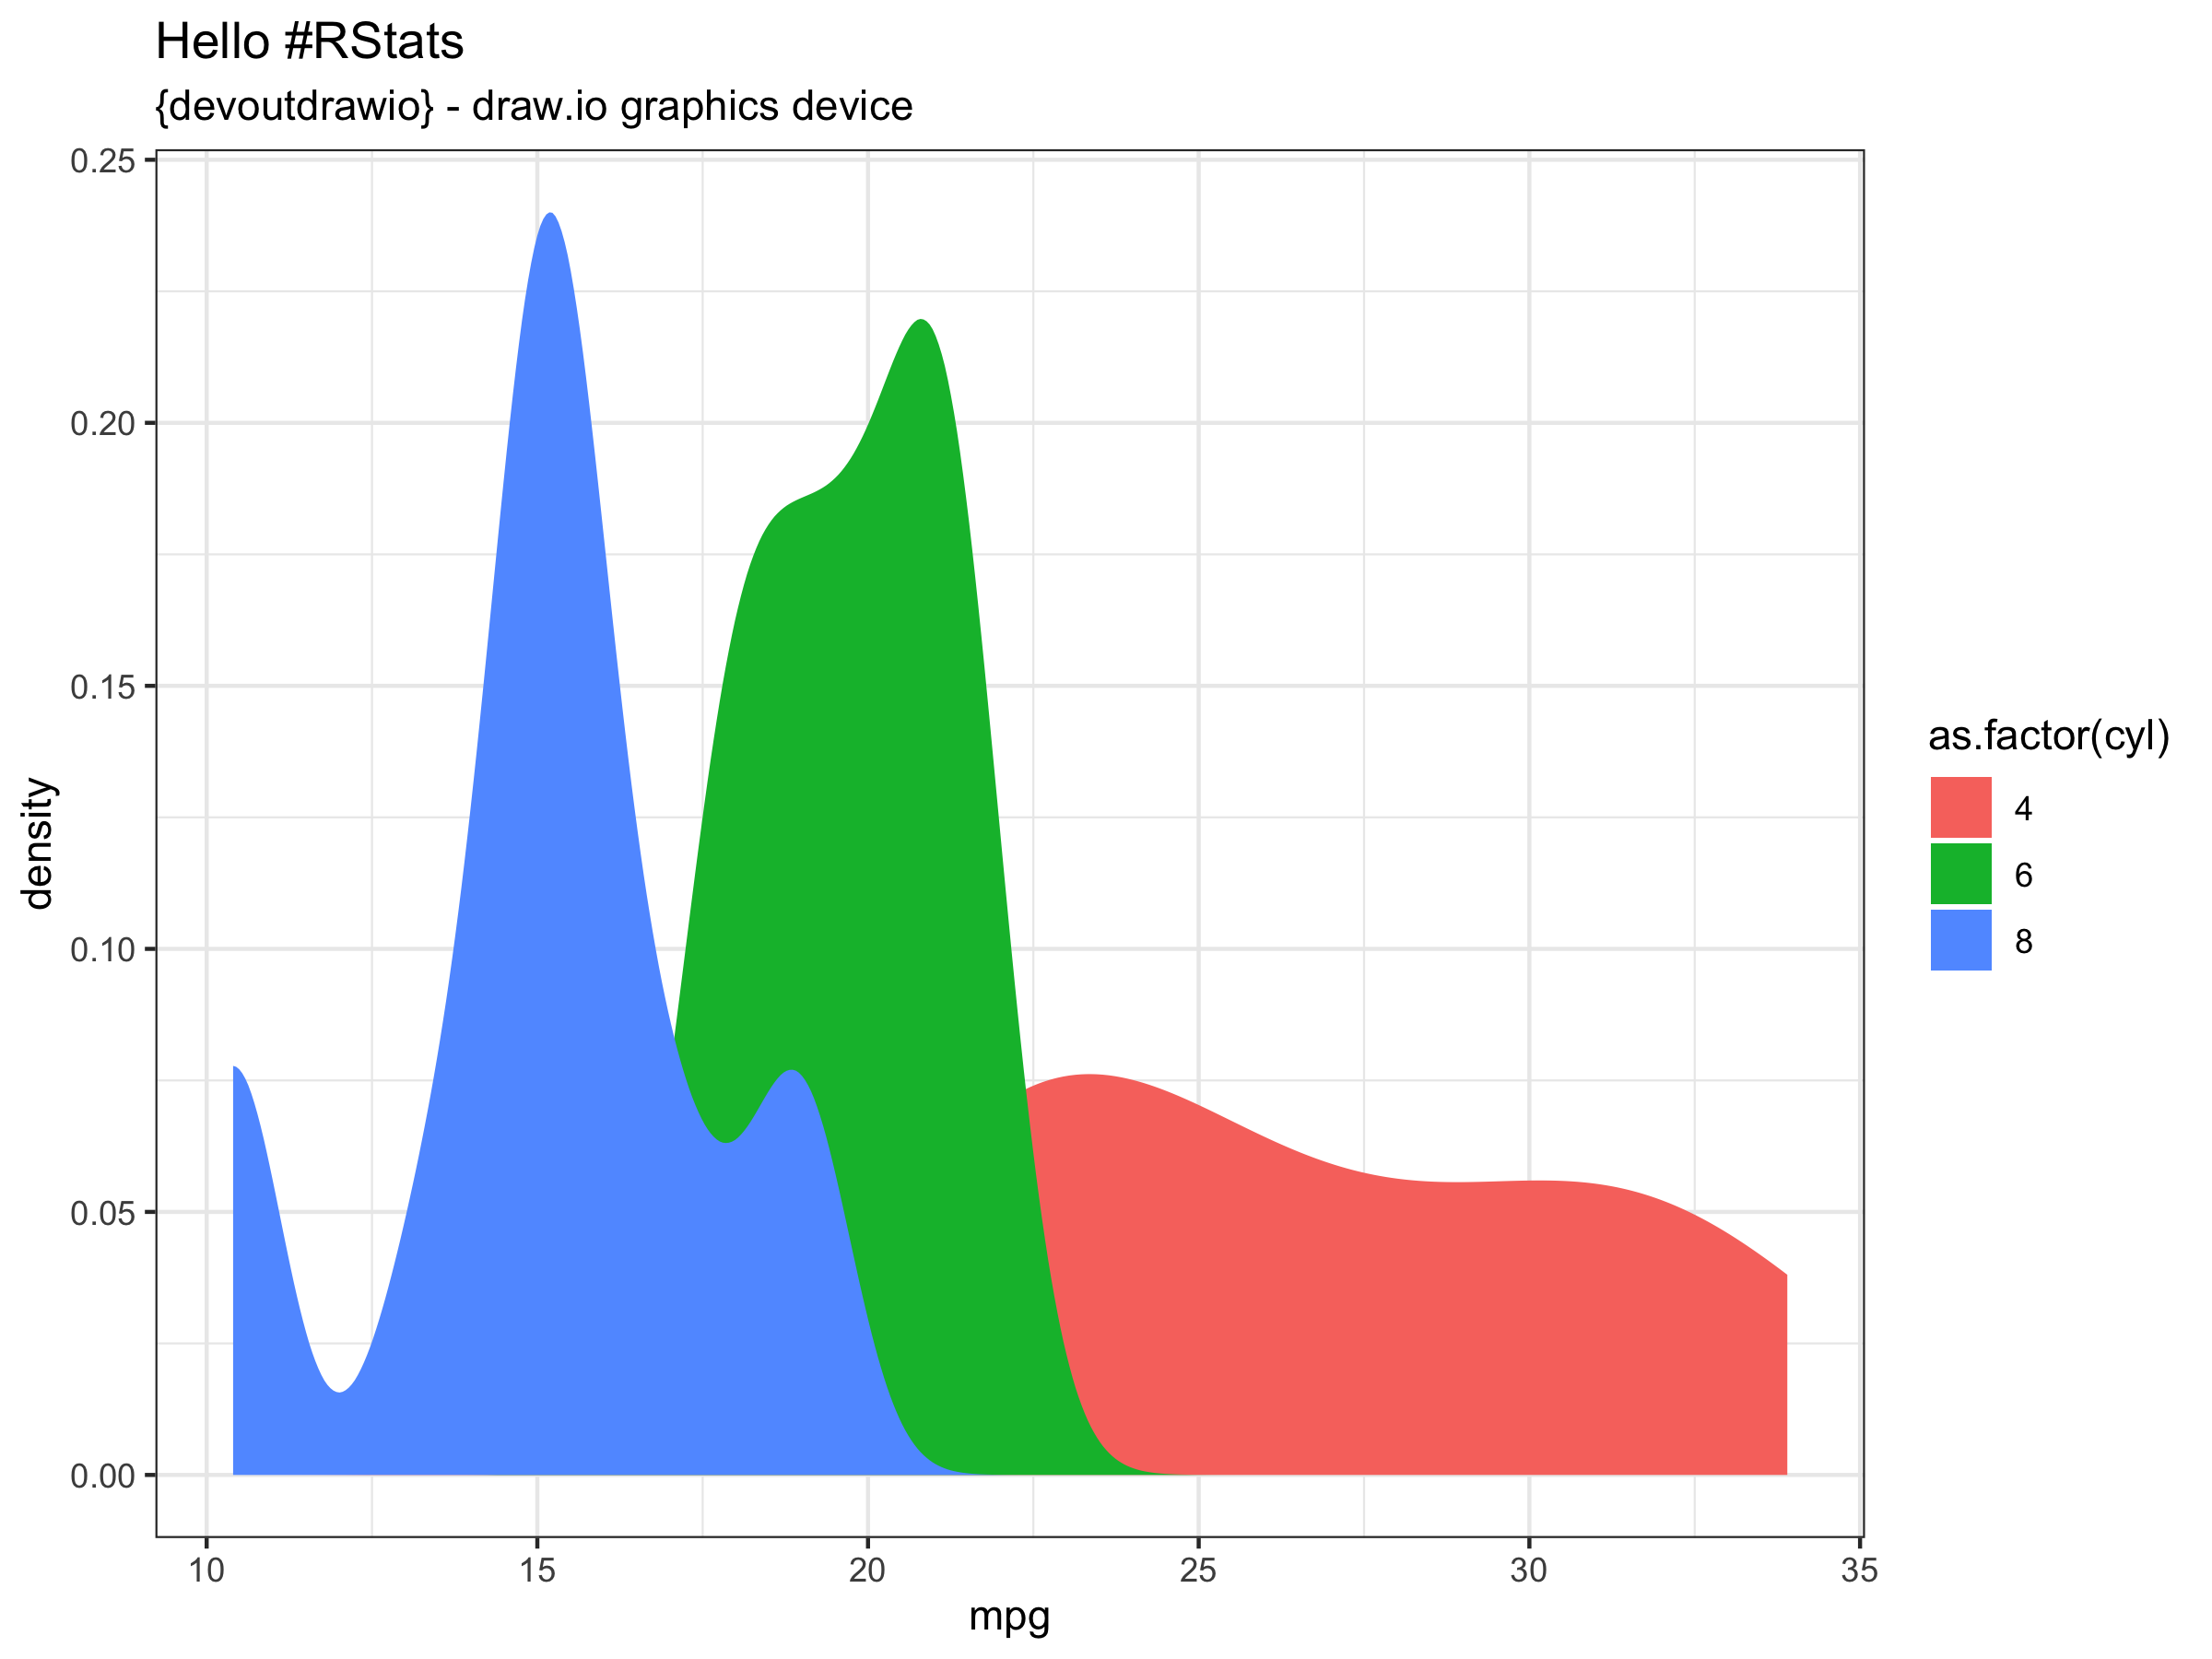
p <- ggplot(mtcars) +
    geom_density(aes(mpg, fill = as.factor(cyl)), colour = NA) +
    theme_bw() +
    labs(title = "Hello #RStats", subtitle = "{devoutdrawio} - draw.io graphics device")
  print(p)
#~~~~~~~~~~~~~~~~~~~~~~~~~~~~~~~~~~~~~~~~~~~~~~~~~~~~~~~~~~~~~~~~~~~~~~~~~~~~~
# Save to drawio XML format
#~~~~~~~~~~~~~~~~~~~~~~~~~~~~~~~~~~~~~~~~~~~~~~~~~~~~~~~~~~~~~~~~~~~~~~~~~~~~~
drawio("/img/devoutdrawio/mtcars.xml")
print(p)
invisible(dev.off())
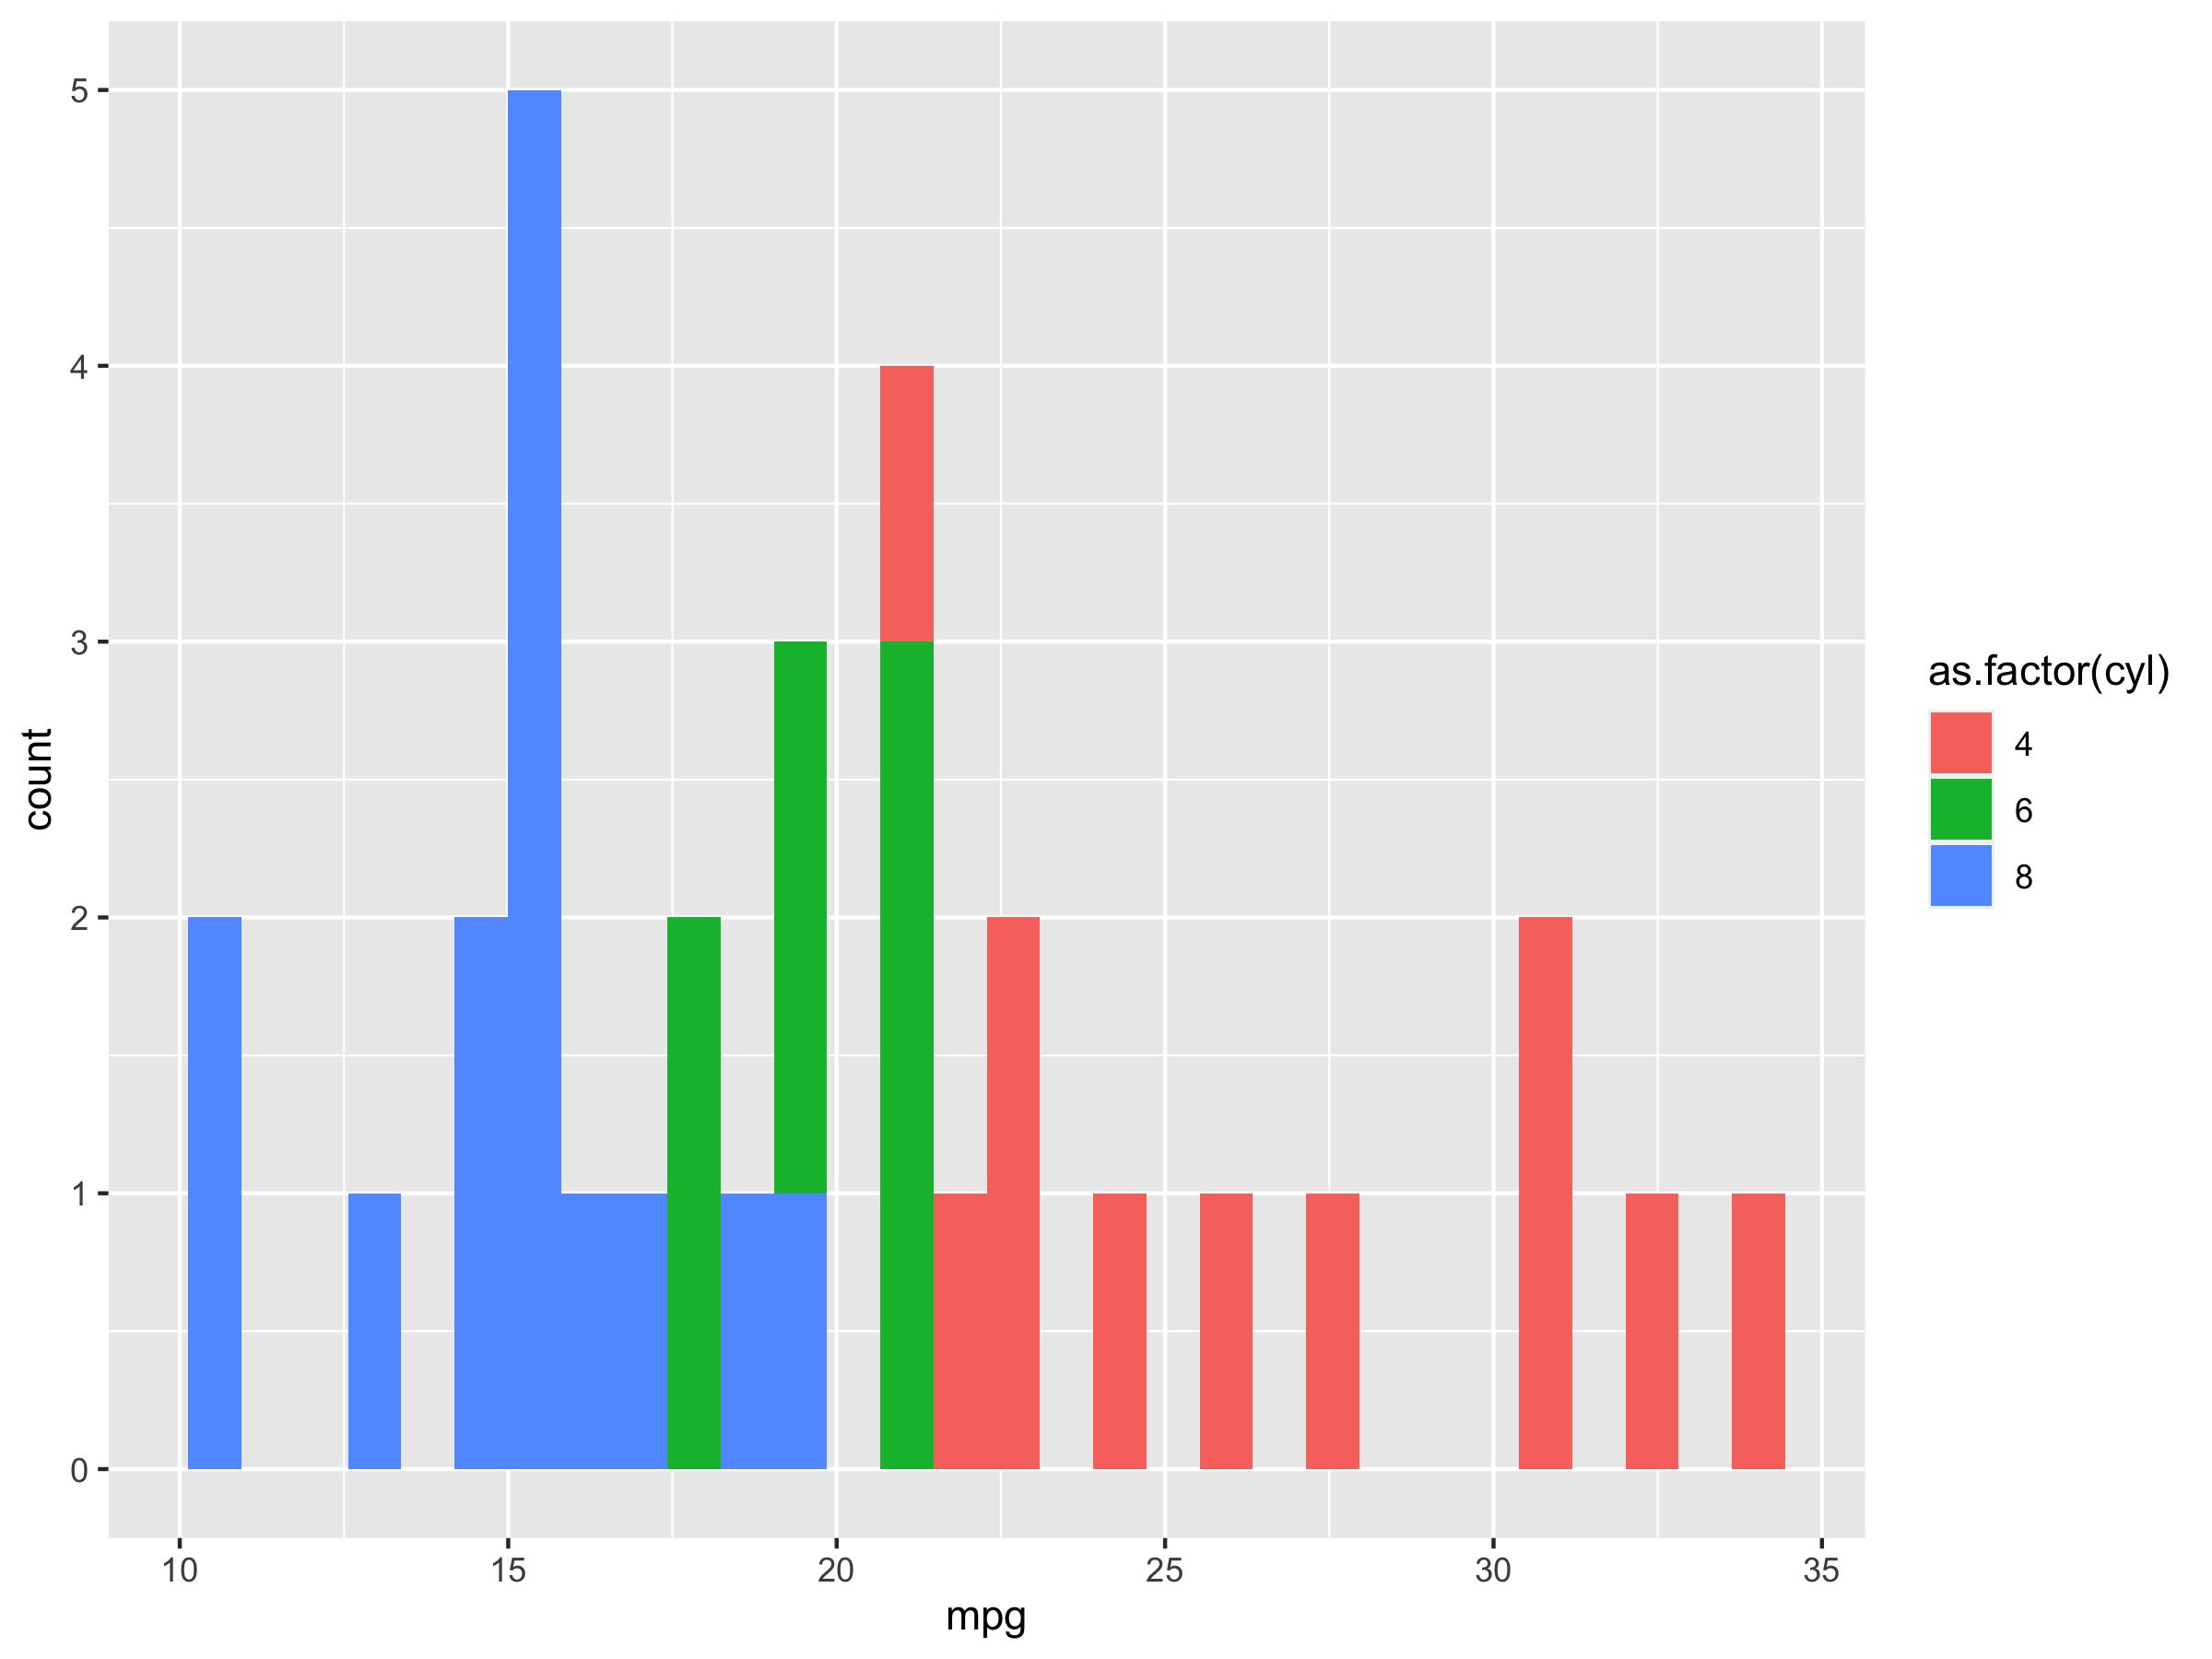
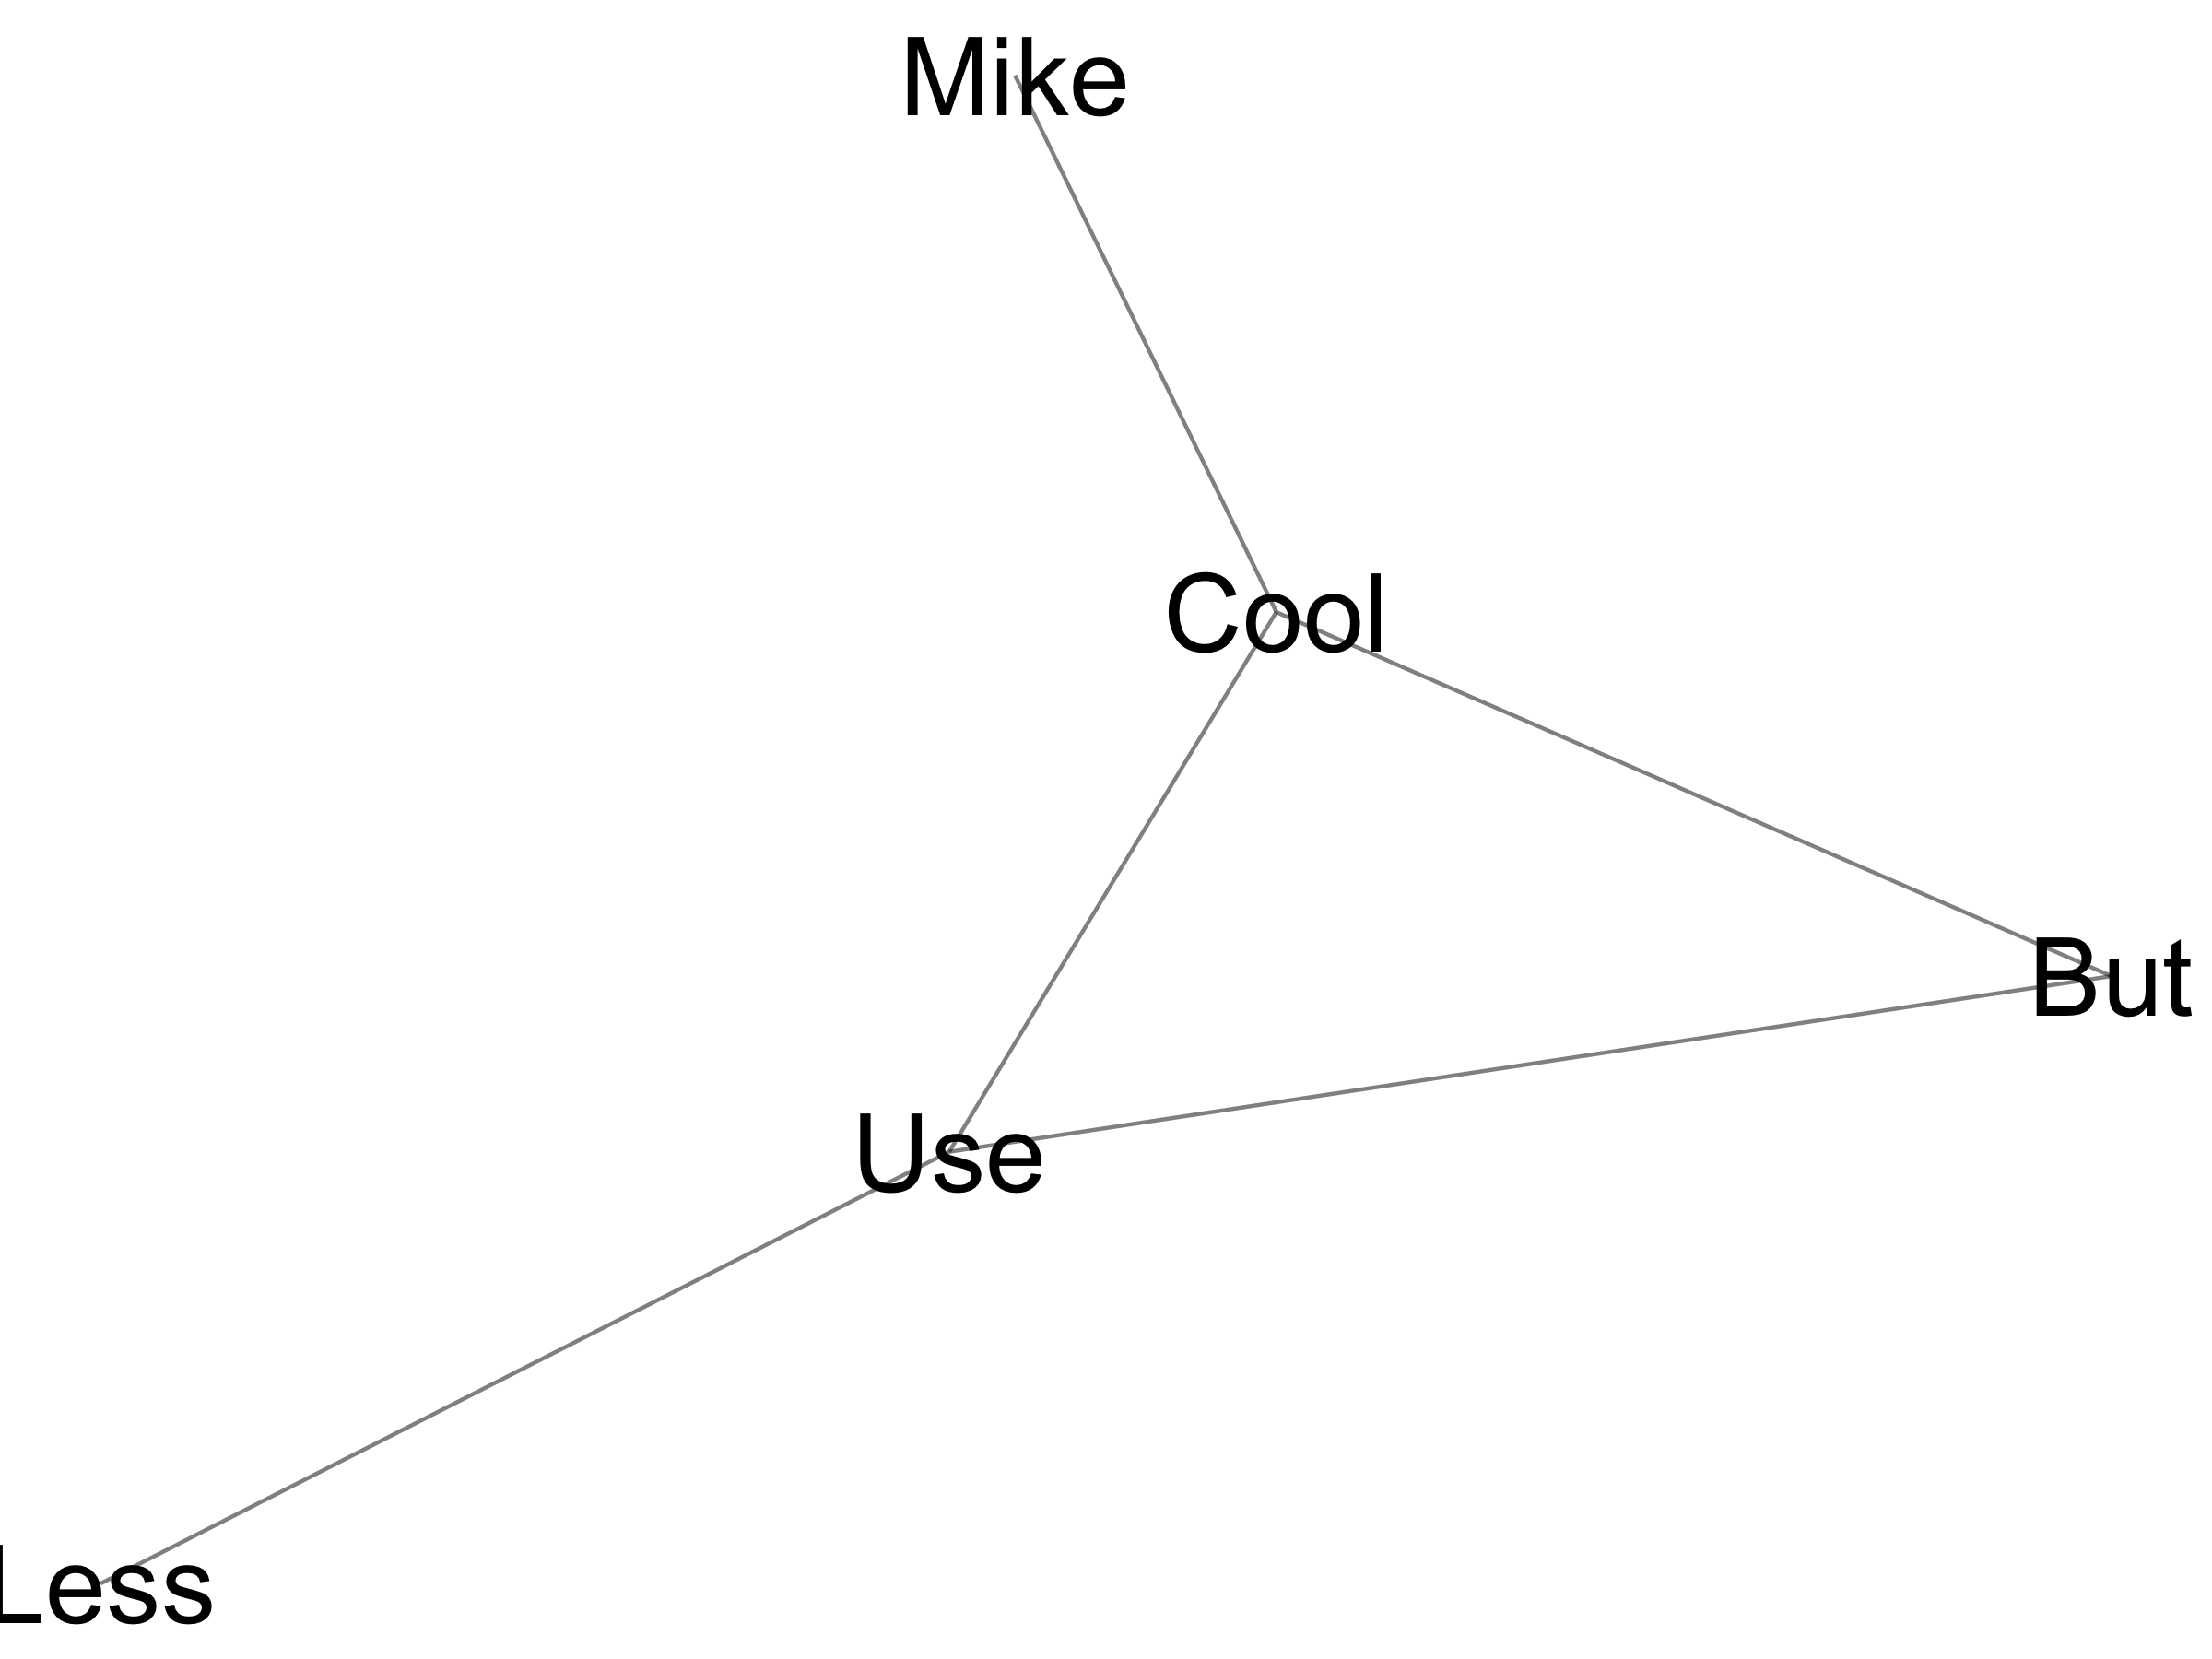
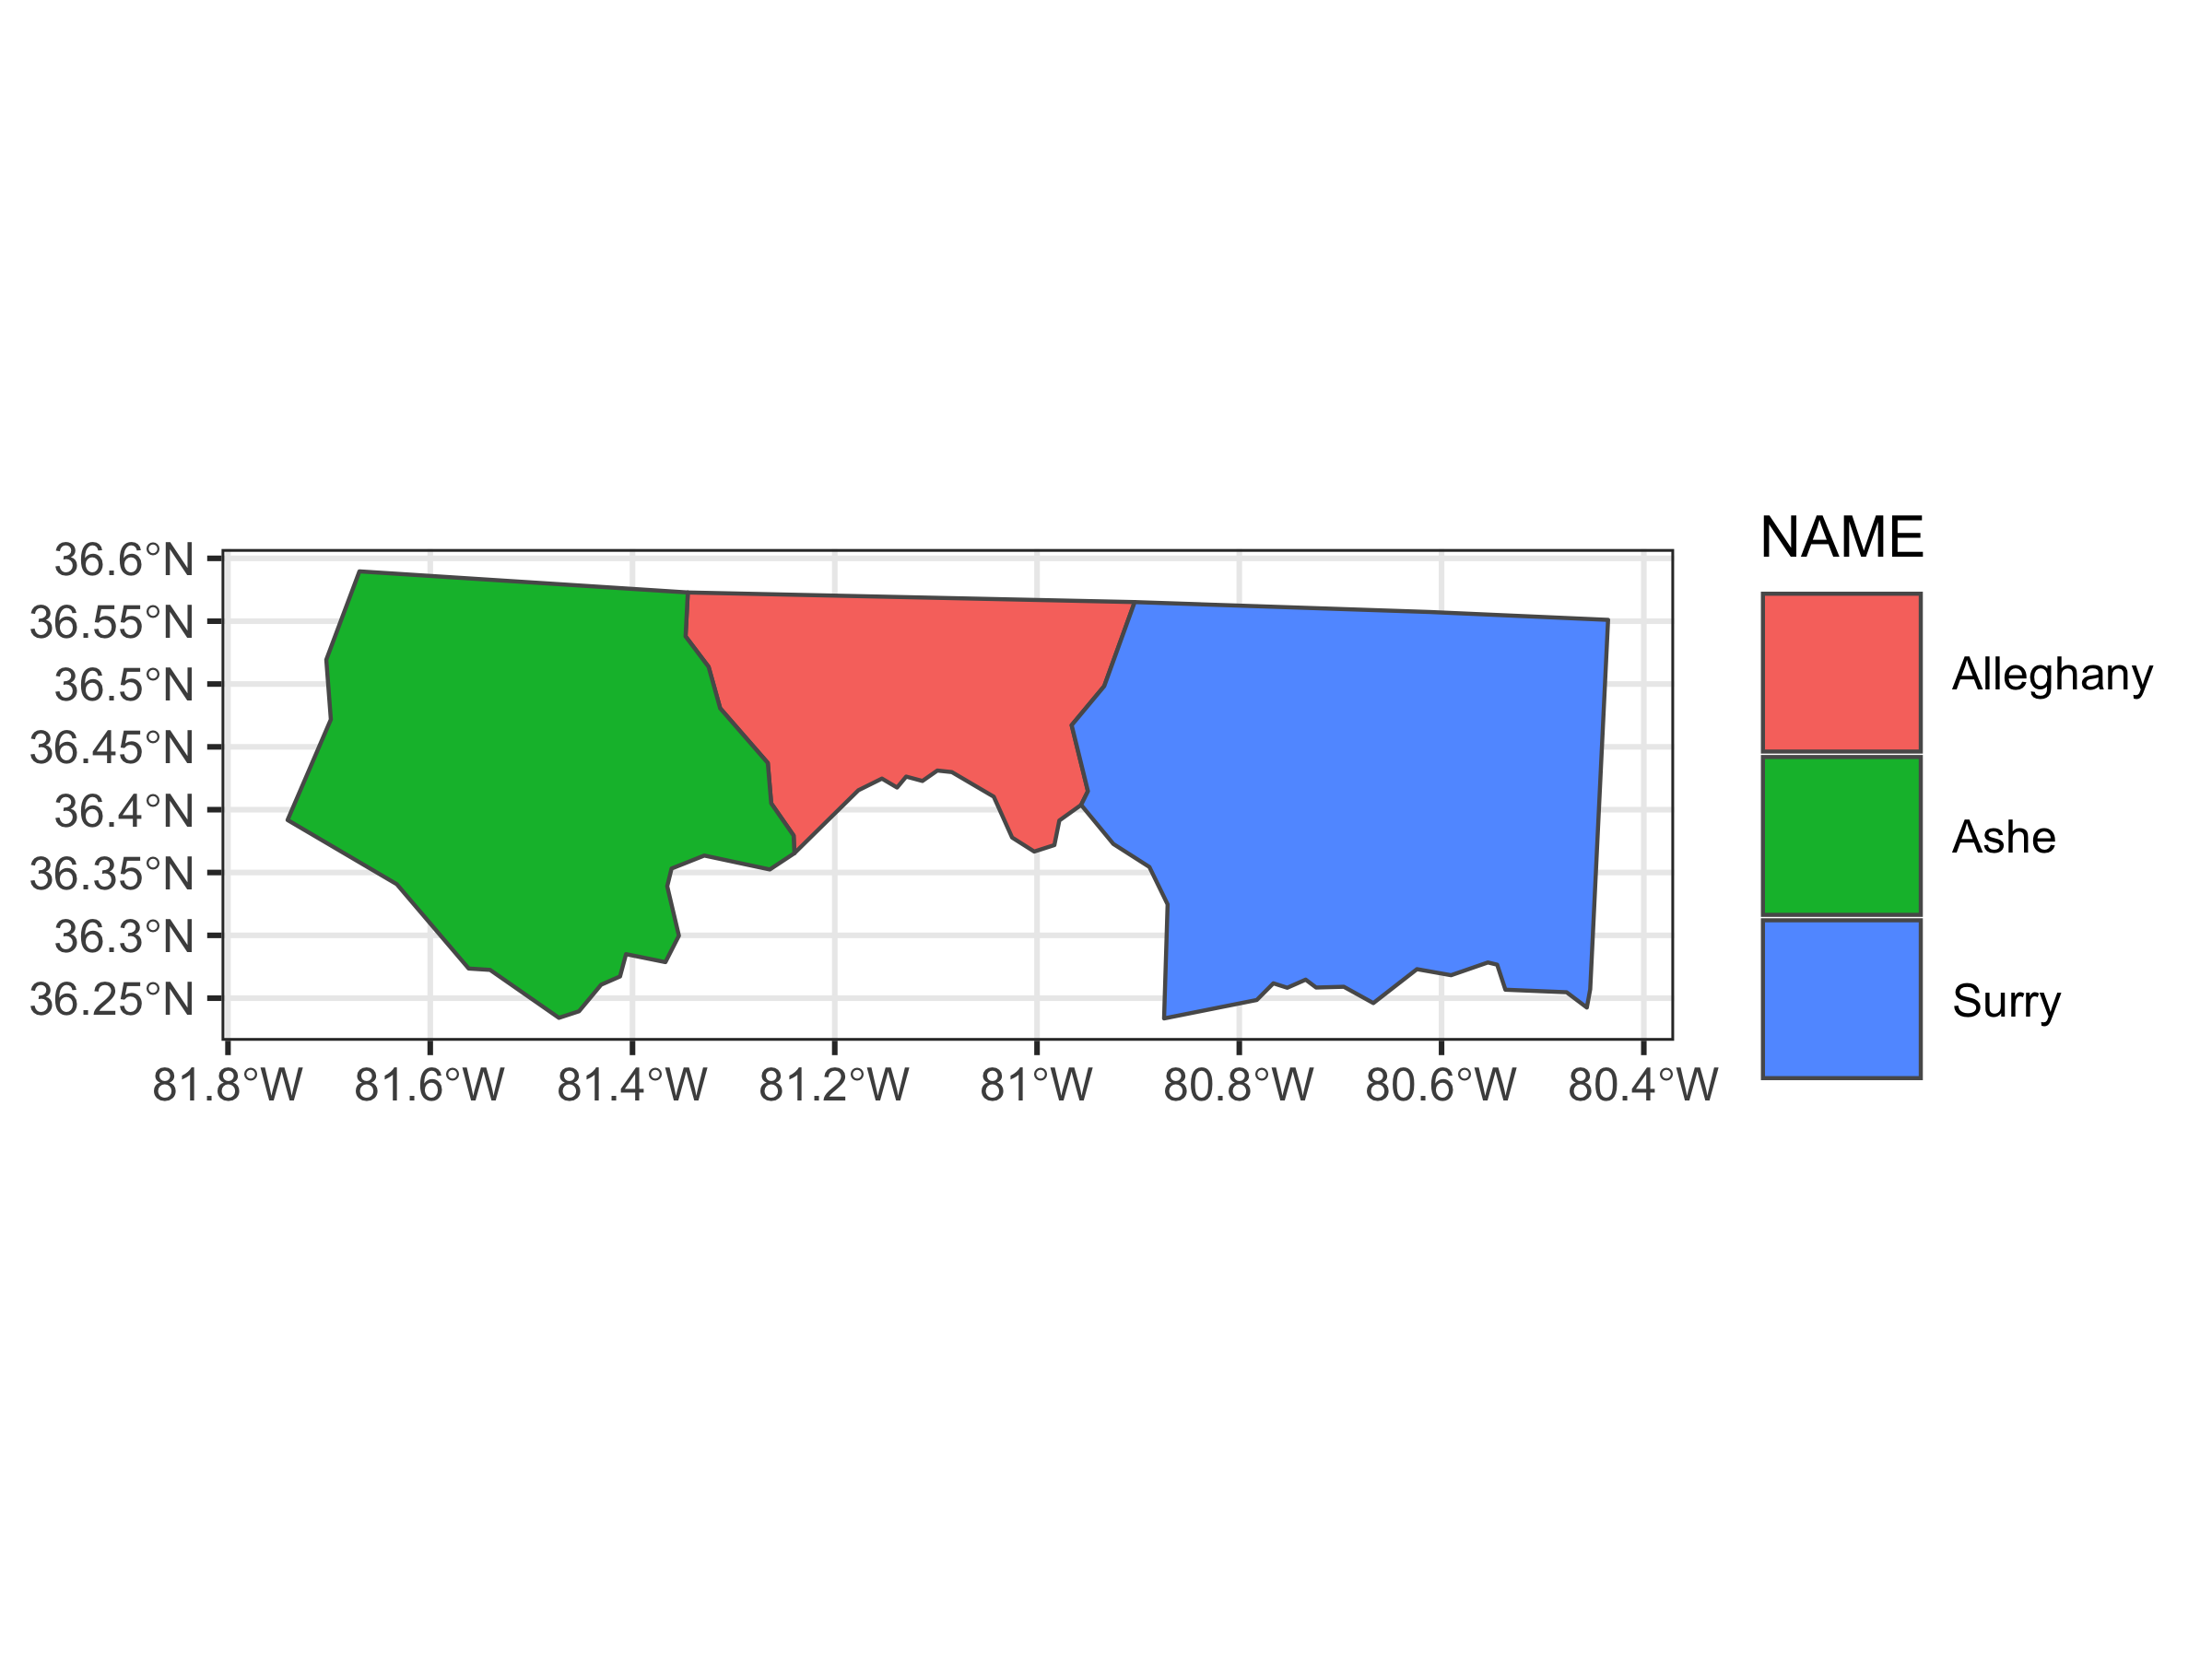
Examples: click to view and edit on draw.io
Click on an image to take you to a draw.io preview page. At the bottom of that page, click on the pencil icon to edit the image in the draw.io web app.
The XML draw.io plots can be downloaded from here: 1, 2, 3, 4
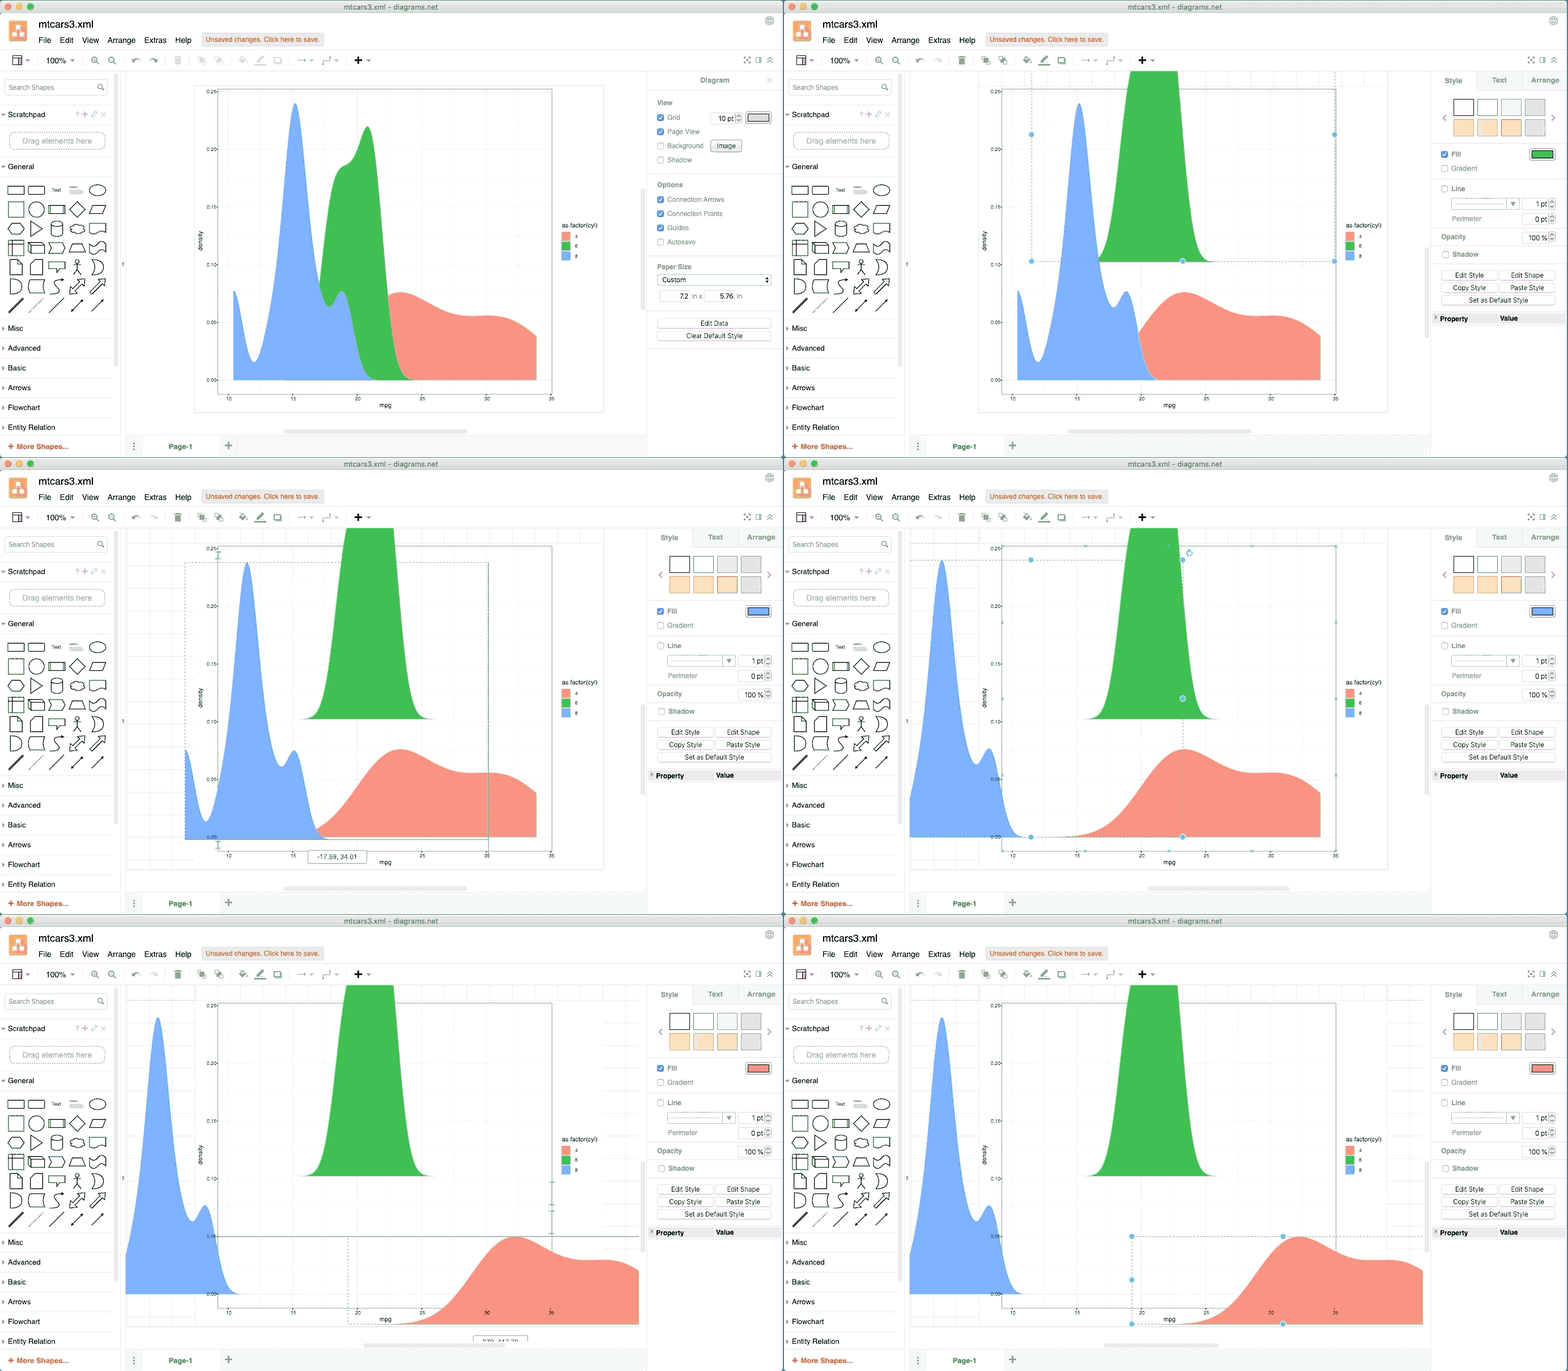
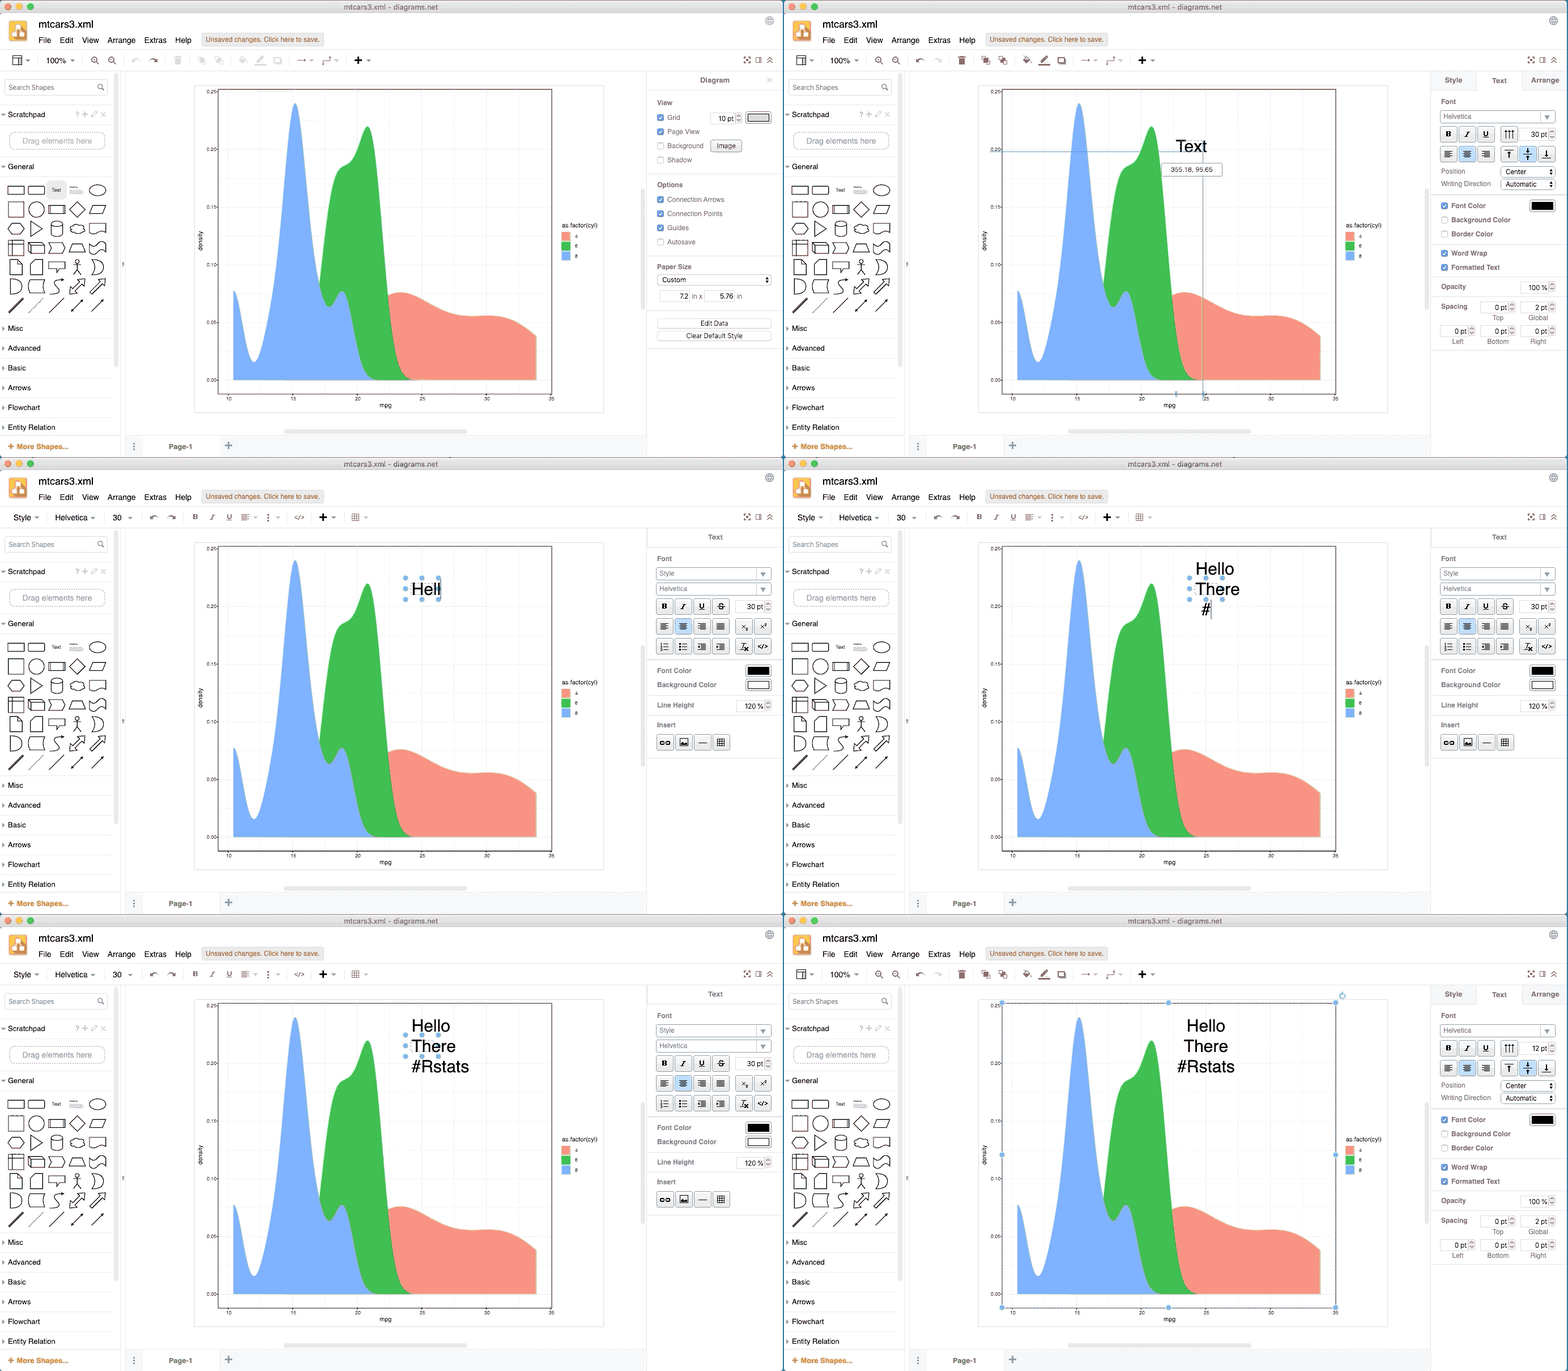
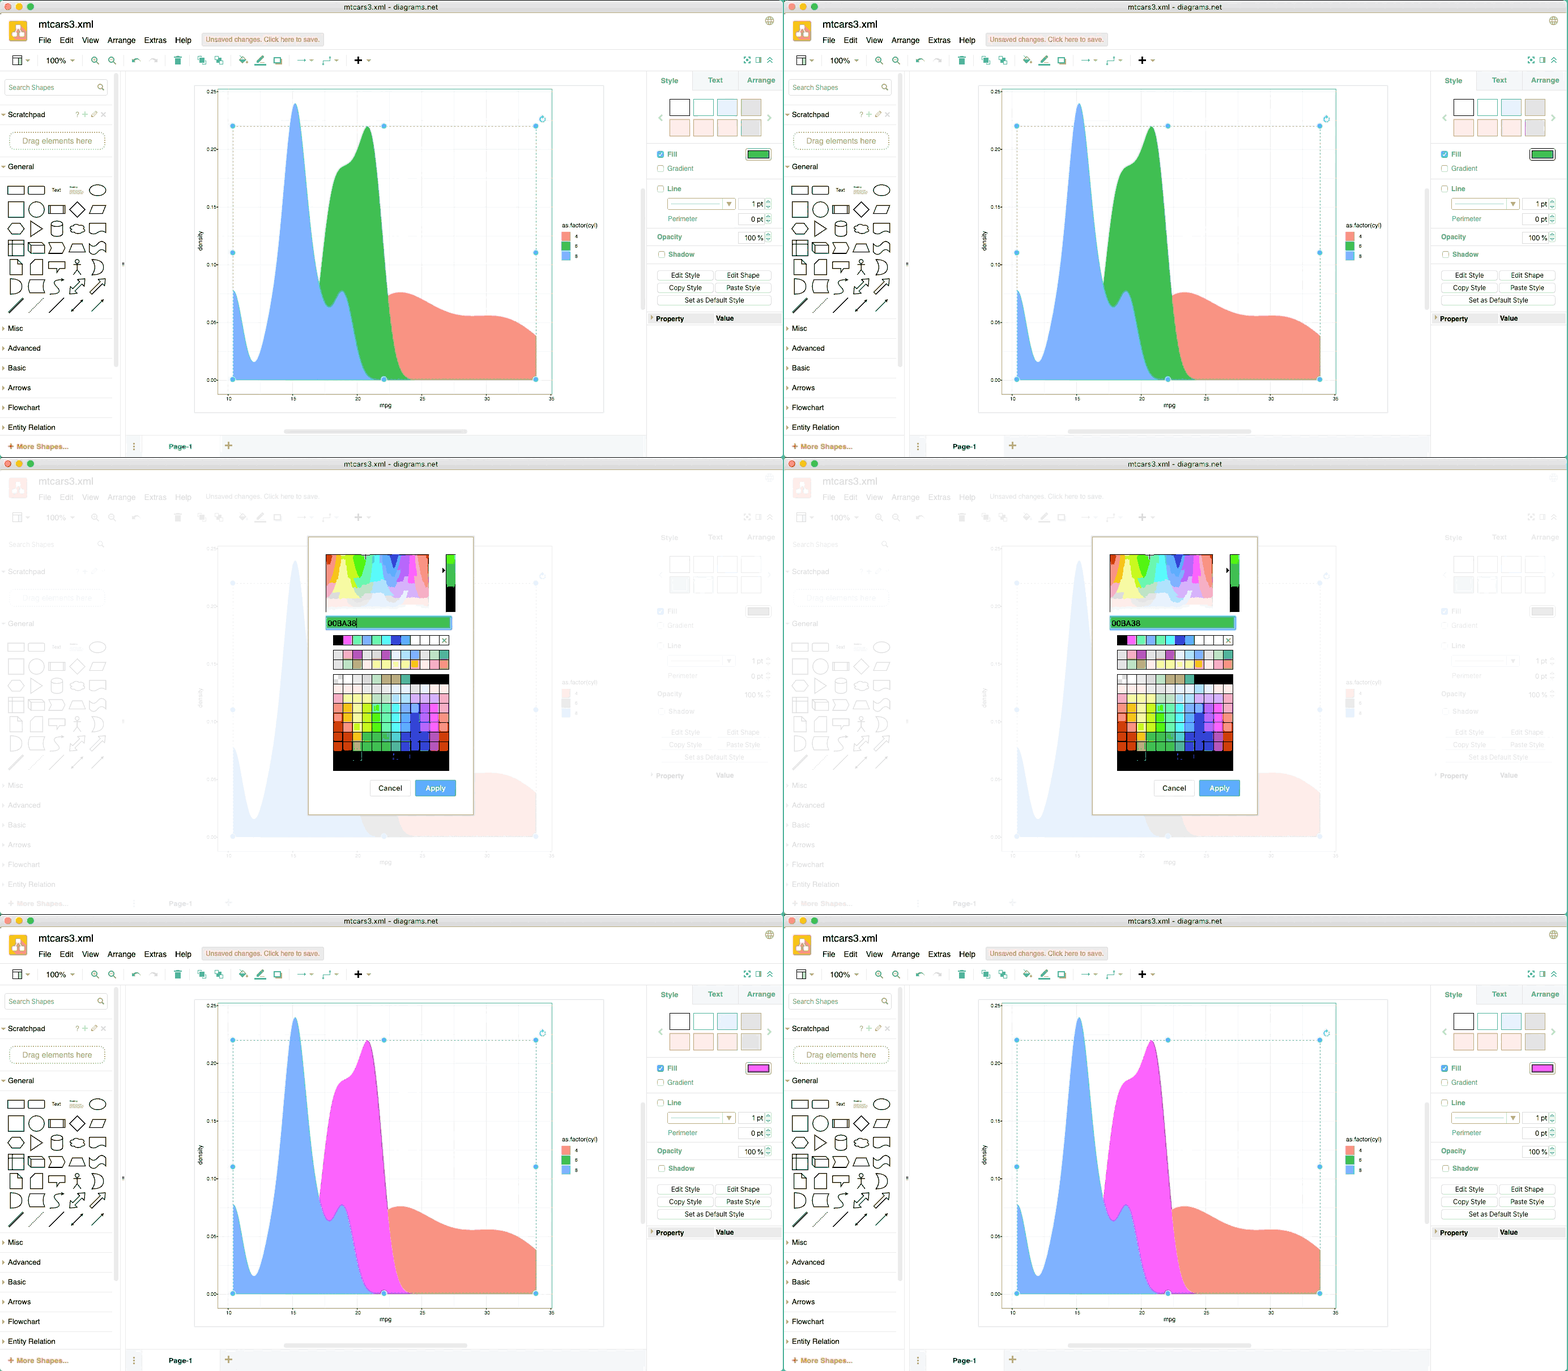
Editing in drawio - moving, adding text, changing colours
Rather than outputting a plot as an array of pixels, the devoutdrawio device
outputs the plot as a collection of geometric elements.
These elements can then be manipulated, resized, deleted or altered, all from
within the drawio web interface.
