devoutansi 
![]()
![]()
devoutansi is a graphics output device for R which will output graphics
as text files with ANSI colouring.
Installation
You can install from GitHub with:
# install.packages("remotes")
remotes::install_github("coolbutuseless/devout")     # devout framework
remotes::install_github("coolbutuseless/miniansi")   # ANSI doc creator
remotes::install_github("coolbutuseless/devoutansi") # this device
Limitations
- No current support for clipping paths or rasters.
- Text positioning and spacing will always be a little off
- Rotated text (except for 0 and 90 degrees) is probably going to be placed incorrectly.
- No support for transparency i.e. alpha has no effect other then to suppress
rendering completely when
alpha = 0
Basic Usage
Use devoutansi::ansi() as you would the pdf() or png() device.
The output will be written as ANSI characters to the screen, or a text file if specified.
Note: - Because you can’t readily view ANSI in an HTML document, all images included are screenshots of the output in my terminal.
Note: Click any image to view its ANSI text
library(ggplot2)
library(devoutansi)

#~~~~~~~~~~~~~~~~~~~~~~~~~~~~~~~~~~~~~~~~~~~~~~~~~~~~~~~~~~~~~~~~~~~~~~~~~~~~~
# PNG output of plot
#~~~~~~~~~~~~~~~~~~~~~~~~~~~~~~~~~~~~~~~~~~~~~~~~~~~~~~~~~~~~~~~~~~~~~~~~~~~~~
p <- ggplot(mtcars) +
  geom_bar(aes(as.factor(cyl), fill = as.factor(cyl)), colour = NA) +
  theme_minimal() +
  theme(
    panel.grid   = element_blank()
  ) +
  labs(
    title    = "{devoutansi} - ANSI graphics device",
    subtitle = "Hello #RStats"
  )

#~~~~~~~~~~~~~~~~~~~~~~~~~~~~~~~~~~~~~~~~~~~~~~~~~~~~~~~~~~~~~~~~~~~~~~~~~~~~~
# ANSI output
#~~~~~~~~~~~~~~~~~~~~~~~~~~~~~~~~~~~~~~~~~~~~~~~~~~~~~~~~~~~~~~~~~~~~~~~~~~~~~
devoutansi::ansi(filename = "/img/devoutansi/mtcars1.txt", width = 120)
  p
invisible(dev.off())
Warning in file(con, "w"): cannot open file '/img/devoutansi/mtcars1.txt': No
such file or directoryWarning in dev.off(): rdevice_close: Evaluation error: cannot open the
connection.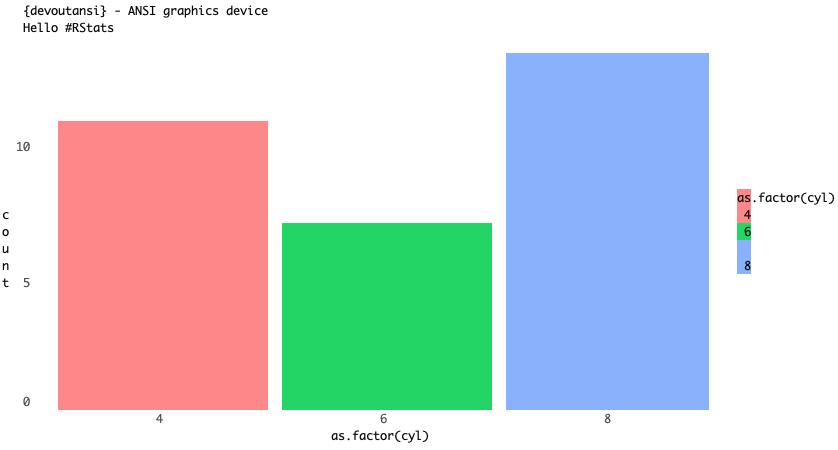
All the demo plots on this page are available as their ANSI txt files by clicking on the images.
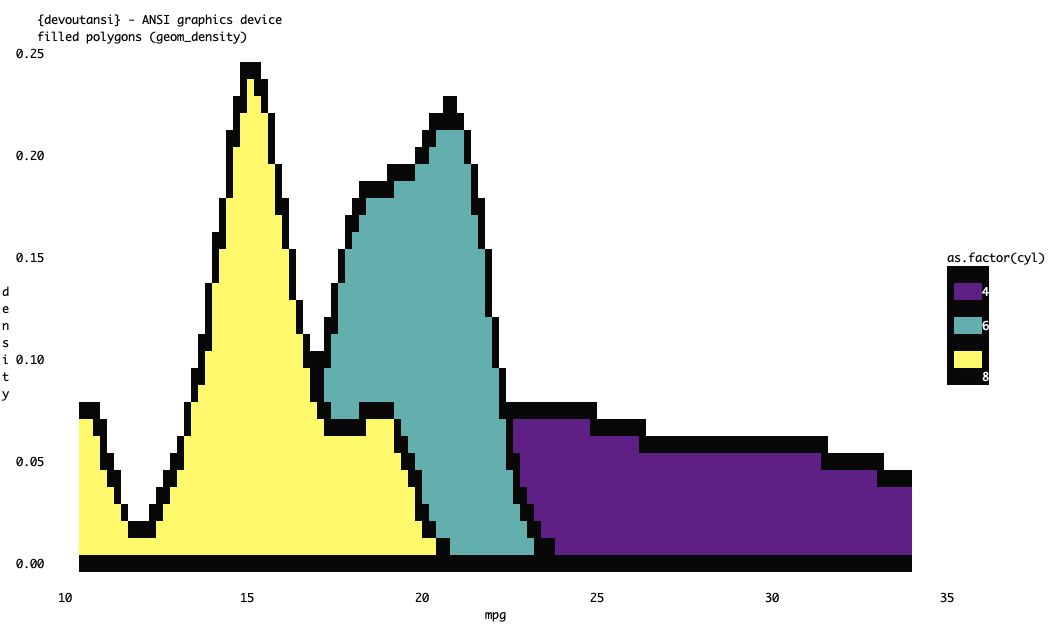
geom_density()
Click to show/hide code
library(ggplot2)

p <- ggplot(mtcars) +
  geom_density(aes(mpg, fill = as.factor(cyl))) +
  theme_minimal() +
  theme(
    panel.grid      = element_blank(),
    legend.key.size = unit(5, 'in')
  ) +
  scale_fill_viridis_d() +
  labs(
    title    = "{devoutansi} - ANSI graphics device",
    subtitle = "filled polygons (geom_density)"
  )

#~~~~~~~~~~~~~~~~~~~~~~~~~~~~~~~~~~~~~~~~~~~~~~~~~~~~~~~~~~~~~~~~~~~~~~~~~~~~~
# ANSI output
#~~~~~~~~~~~~~~~~~~~~~~~~~~~~~~~~~~~~~~~~~~~~~~~~~~~~~~~~~~~~~~~~~~~~~~~~~~~~~
devoutansi::ansi("/img/devoutansi/mtcars3.txt", width = 150)
p
invisible(dev.off())
Warning in file(con, "w"): cannot open file '/img/devoutansi/mtcars3.txt': No
such file or directoryWarning in dev.off(): rdevice_close: Evaluation error: cannot open the
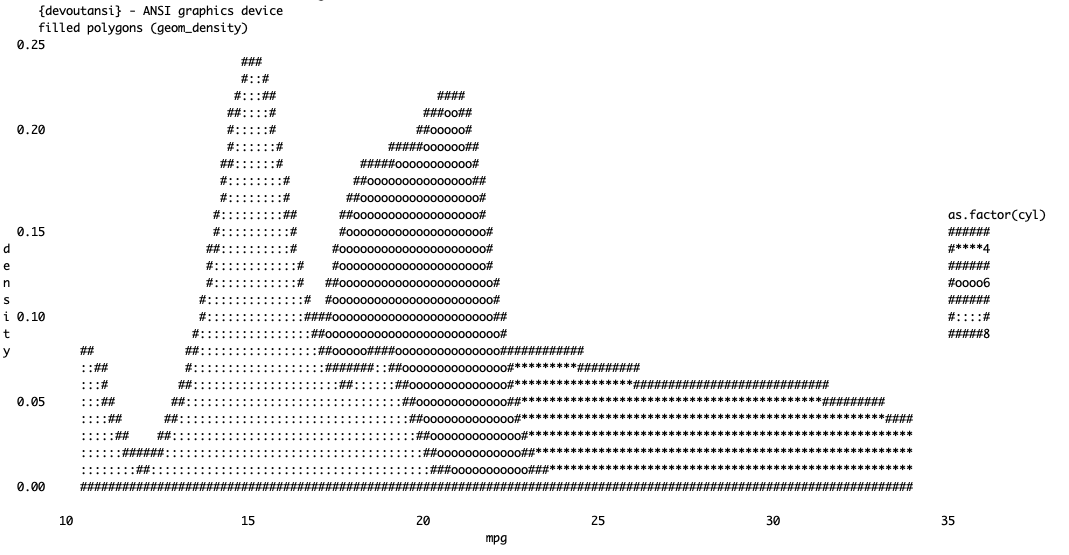
connection.geom_density() in ASCII only
Click to show/hide code
Extra options for ASCII mode:
char_lookup_tableset to 1, 2 or 3 to select the character setpownonlinear intensity remapping using this exponent. default 1
#~~~~~~~~~~~~~~~~~~~~~~~~~~~~~~~~~~~~~~~~~~~~~~~~~~~~~~~~~~~~~~~~~~~~~~~~~~~~~
# ANSI output
#~~~~~~~~~~~~~~~~~~~~~~~~~~~~~~~~~~~~~~~~~~~~~~~~~~~~~~~~~~~~~~~~~~~~~~~~~~~~~
devoutansi::ansi("/img/devoutansi/mtcars3-ascii.txt", width = 150, plain_ascii = TRUE)
p
invisible(dev.off())
Warning in file(con, "w"): cannot open file '/img/devoutansi/mtcars3-ascii.txt':
No such file or directoryWarning in dev.off(): rdevice_close: Evaluation error: cannot open the
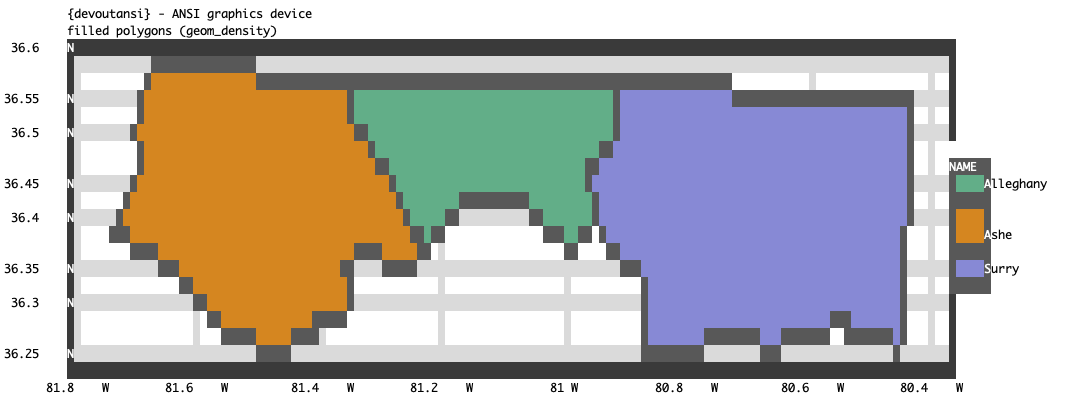
connection.geom_sf()
Click to show/hide code
library(dplyr)
library(sf)
library(ggplot2)
library(devoutansi)

nc <- sf::st_read(system.file("shape/nc.shp", package = "sf"), quiet = TRUE)
nc <- nc %>% filter(between(CNTY_ID, 1820, 1830))

p <- ggplot(nc) +
  geom_sf(aes(fill = NAME)) +
  theme_bw(15) +
  theme(legend.key.size = unit(5, 'in')) +
  scale_fill_brewer(palette = 'Dark2') +
  labs(
    title    = "{devoutansi} - ANSI graphics device",
    subtitle = "filled polygons (geom_density)"
  )

#~~~~~~~~~~~~~~~~~~~~~~~~~~~~~~~~~~~~~~~~~~~~~~~~~~~~~~~~~~~~~~~~~~~~~~~~~~~~~
# ANSI output
#~~~~~~~~~~~~~~~~~~~~~~~~~~~~~~~~~~~~~~~~~~~~~~~~~~~~~~~~~~~~~~~~~~~~~~~~~~~~~
devoutansi::ansi("/img/devoutansi/geom-sf.txt", width = 150)
p
invisible(dev.off())
Warning in file(con, "w"): cannot open file '/img/devoutansi/geom-sf.txt': No
such file or directoryWarning in dev.off(): rdevice_close: Evaluation error: cannot open the
connection.pie plot from base R

Click to show/hide code
devoutansi::ansi("/img/devoutansi/pie.txt", width = 180)
pie(c(cool = 4, but = 2, use = 1, less = 8), main = "ANSI graphics device - Base pie plot")
invisible(dev.off())
Warning in file(con, "w"): cannot open file '/img/devoutansi/pie.txt': No such
file or directoryWarning in dev.off(): rdevice_close: Evaluation error: cannot open the
connection.geom_histogram()
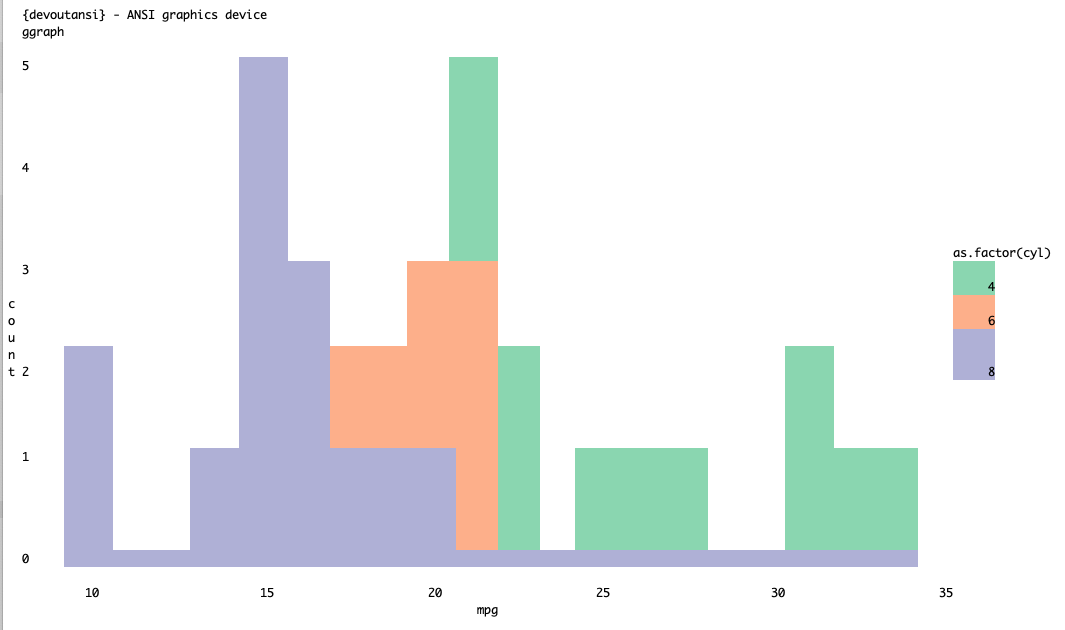
Click to show/hide code
library(ggplot2)

p <- ggplot(mtcars) +
  geom_histogram(aes(mpg, fill = as.factor(cyl)), bins = 20) +
  theme_minimal() +
  theme(
    panel.grid      = element_blank(),
    legend.key.size = unit(5, 'in')
  ) +
  labs(
    title    = "{devoutansi} - ANSI graphics device",
    subtitle = "ggraph"
  ) +
  scale_fill_brewer(palette = 'Set2')

#~~~~~~~~~~~~~~~~~~~~~~~~~~~~~~~~~~~~~~~~~~~~~~~~~~~~~~~~~~~~~~~~~~~~~~~~~~~~~
# ANSI output
#~~~~~~~~~~~~~~~~~~~~~~~~~~~~~~~~~~~~~~~~~~~~~~~~~~~~~~~~~~~~~~~~~~~~~~~~~~~~~
ansi("/img/devoutansi/mtcars2.txt", width = 150)
p
invisible(dev.off())
Warning in file(con, "w"): cannot open file '/img/devoutansi/mtcars2.txt': No
such file or directoryWarning in dev.off(): rdevice_close: Evaluation error: cannot open the
connection.ggraph

Click to show/hide code
library(ggplot2)
library(ggraph)
library(tidygraph)
library(dplyr)

set.seed(1)
simple <- create_notable('bull') %>%
  mutate(name = c('But', 'Use', 'Cool', 'Less', 'Mike')) %>%
  activate(edges) %>%
  mutate(type = sample(c('friend', 'foe'), 5, TRUE))

p <- ggraph(simple, layout = 'graphopt') +
  geom_edge_link0(colour = 'grey70') +
  geom_node_text(aes(label = name), size = 10) +
  theme_void() +
  labs(
    title    = "{devoutansi} - ANSI graphics device",
    subtitle = "ggraph"
  )

#~~~~~~~~~~~~~~~~~~~~~~~~~~~~~~~~~~~~~~~~~~~~~~~~~~~~~~~~~~~~~~~~~~~~~~~~~~~~~
# ANSI output
#~~~~~~~~~~~~~~~~~~~~~~~~~~~~~~~~~~~~~~~~~~~~~~~~~~~~~~~~~~~~~~~~~~~~~~~~~~~~~
ansi("/img/devoutansi/ggraph.txt", width = 150)
p
invisible(dev.off())
Warning in file(con, "w"): cannot open file '/img/devoutansi/ggraph.txt': No
such file or directoryWarning in dev.off(): rdevice_close: Evaluation error: cannot open the
connection.