cairobasic
![]()
![]()
cairobasic is a package which provides a fast canvas for drawing operations.
This is a really demonstration package showing how cairocore may be made more palatable for programming within R.
This package currently only offers some basic drawing tools, but could easily be forked/expanded to suit different needs.
To get the most out of CairoGraphics at this stage,
you would still need to use cairocore, but cairobasic will accumulate
features based upon user feedback.
Installation
You can install from GitHub with:
# install.package('remotes')
remotes::install_github('coolbutuseless/cairobasic')
Using cairobasic
The cairobasic package provides an R6
class (CairoBasic) which keeps track of context information for rendering and
the actual rendering surface.
library(cairobasic)

#~~~~~~~~~~~~~~~~~~~~~~~~~~~~~~~~~~~~~~~~~~~~~~~~~~~~~~~~~~~~~~~~~~~~~~~~~~~~~
# Create a new 'CairoBasic' object
#~~~~~~~~~~~~~~~~~~~~~~~~~~~~~~~~~~~~~~~~~~~~~~~~~~~~~~~~~~~~~~~~~~~~~~~~~~~~~
width  <- 800
height <- 400
cb     <- CairoBasic$new(width = width, height = height)


#~~~~~~~~~~~~~~~~~~~~~~~~~~~~~~~~~~~~~~~~~~~~~~~~~~~~~~~~~~~~~~~~~~~~~~~~~~~~~
# Add concentric circles
#~~~~~~~~~~~~~~~~~~~~~~~~~~~~~~~~~~~~~~~~~~~~~~~~~~~~~~~~~~~~~~~~~~~~~~~~~~~~~
N <- 10
cb$add_circles(
  x    = rep(width/2, N),
  y    = 0,
  r    = seq(width, 0, length.out = N),
  fill = '#80808020'
)

#~~~~~~~~~~~~~~~~~~~~~~~~~~~~~~~~~~~~~~~~~~~~~~~~~~~~~~~~~~~~~~~~~~~~~~~~~~~~~
# Add Lines with rainbow colouring
#~~~~~~~~~~~~~~~~~~~~~~~~~~~~~~~~~~~~~~~~~~~~~~~~~~~~~~~~~~~~~~~~~~~~~~~~~~~~~
N <- 500
cb$add_line_segments(
  x1 = rep(width/2, N),
  y1 = 0,
  x2 = seq(1, width, length.out = N),
  y2 = height,
  colour = rainbow(N, alpha = 0.1)
)

#~~~~~~~~~~~~~~~~~~~~~~~~~~~~~~~~~~~~~~~~~~~~~~~~~~~~~~~~~~~~~~~~~~~~~~~~~~~~~
# Add rectangles
#~~~~~~~~~~~~~~~~~~~~~~~~~~~~~~~~~~~~~~~~~~~~~~~~~~~~~~~~~~~~~~~~~~~~~~~~~~~~~
N <- 10

xy <- expand.grid(x = seq(1, width/2, width/32), y = seq(1, height, width/32))
xy <- subset(xy, y < width/2 - x - width/16)

cb$add_rectangles(
  x      = xy$x,
  y      = xy$y,
  width  = width/32,
  height = width/32,
  fill   = terrain.colors(nrow(xy)),
  colour = '#20202020'
)


#~~~~~~~~~~~~~~~~~~~~~~~~~~~~~~~~~~~~~~~~~~~~~~~~~~~~~~~~~~~~~~~~~~~~~~~~~~~~~
# Add polygons
#~~~~~~~~~~~~~~~~~~~~~~~~~~~~~~~~~~~~~~~~~~~~~~~~~~~~~~~~~~~~~~~~~~~~~~~~~~~~~
cx  <- width  * 0.85
cy  <- height * 0.35
ang <- seq(0, 2*pi, pi/3)

x1  <- cx + 50 * sin(ang)
y1  <- cy + 50 * cos(ang)

x2  <- cx + 60 * sin(ang)
y2  <- cy + 60 * cos(ang)

x   <- c(x1, x2)
y   <- c(y1, y2)
idx <- as.integer(c(1, 1, 1, 1, 1, 1, 1,   2, 2, 2, 2, 2, 2, 2))

cb$add_polygons(
  x, y, idx, fill = NA,
  linewidth = 5,
  colour = c('red', 'blue'))


#~~~~~~~~~~~~~~~~~~~~~~~~~~~~~~~~~~~~~~~~~~~~~~~~~~~~~~~~~~~~~~~~~~~~~~~~~~~~~
# Add Text
#~~~~~~~~~~~~~~~~~~~~~~~~~~~~~~~~~~~~~~~~~~~~~~~~~~~~~~~~~~~~~~~~~~~~~~~~~~~~~
cb$add_text("{cairobasic}", width*0.65 + 1, 10, fontsize = 50, colour = 'white')
cb$add_text("{cairobasic}", width*0.65    , 11, fontsize = 50, colour = '#606060a0')


#~~~~~~~~~~~~~~~~~~~~~~~~~~~~~~~~~~~~~~~~~~~~~~~~~~~~~~~~~~~~~~~~~~~~~~~~~~~~~
# Show it
#~~~~~~~~~~~~~~~~~~~~~~~~~~~~~~~~~~~~~~~~~~~~~~~~~~~~~~~~~~~~~~~~~~~~~~~~~~~~~
cb$show(interpolate = TRUE)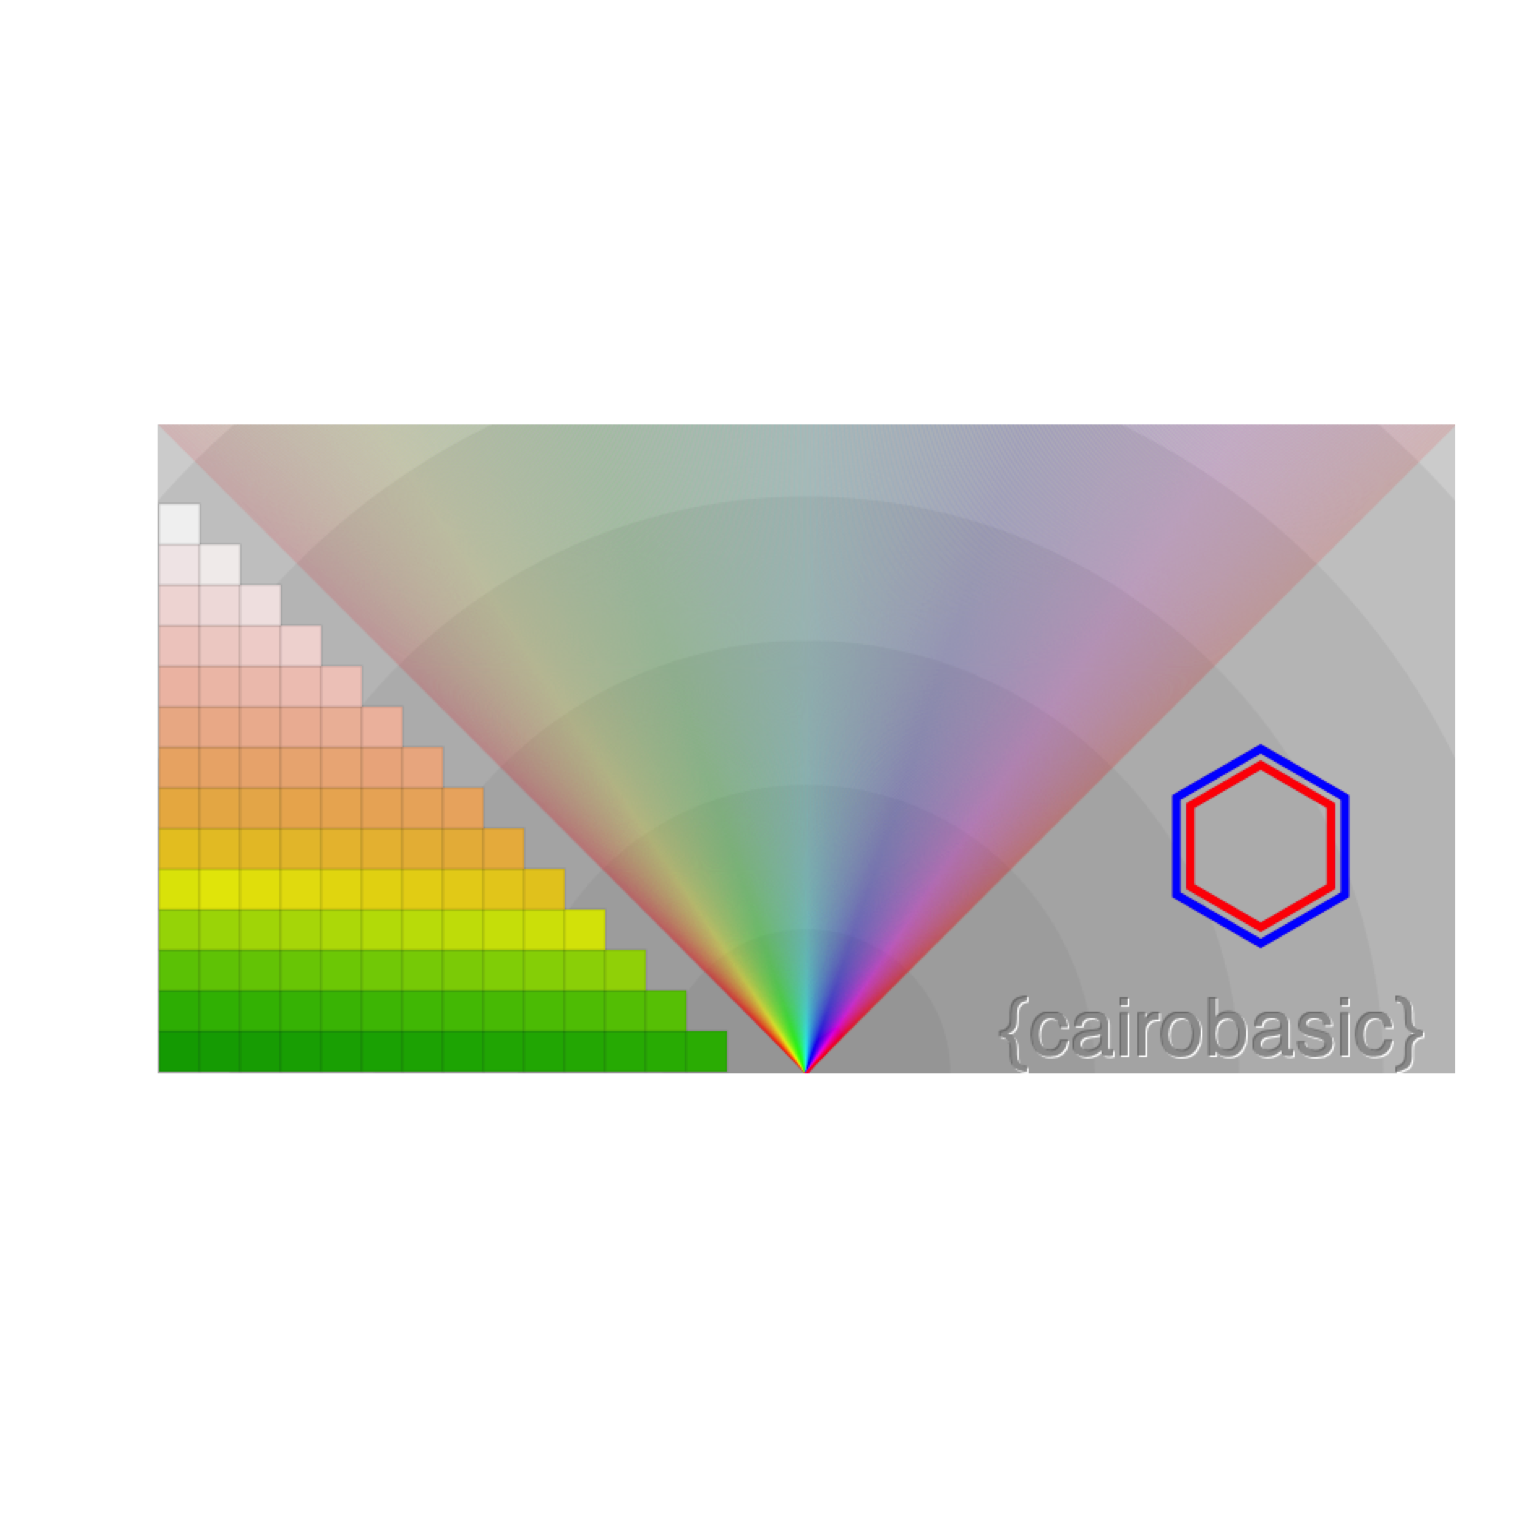
#~~~~~~~~~~~~~~~~~~~~~~~~~~~~~~~~~~~~~~~~~~~~~~~~~~~~~~~~~~~~~~~~~~~~~~~~~~~~~
# Save to PNG
#~~~~~~~~~~~~~~~~~~~~~~~~~~~~~~~~~~~~~~~~~~~~~~~~~~~~~~~~~~~~~~~~~~~~~~~~~~~~~
cb$write_png("output.png")
Working with cairocore
Read the cairocore README for more information
library(cairocore)

cairo_set_source_rgba(cb$cr, 1, 0, 0, 0.3)
cairo_set_line_width(cb$cr, 10)
cairo_set_dash(cb$cr, c(10, 15, 25), 3, 0)
cairo_rectangle(cb$cr, 100, 100, width-200, height-200)
cairo_stroke(cb$cr)

cb$show()
Acknowledgements
- R Core for developing and maintaining the language.
- CRAN maintainers, for patiently shepherding packages onto CRAN and maintaining the repository