snowcrash 
![]()
![]()
![]()
snowcrash is a package for encoding arbitrary R objects as rasters, PNGs
and rasterGrobs.
Why?
Although this may seem like a frivolous package, encoding data as images is one way to transmit information to a graphics device through an otherwise impenetrable barrier. This package is needed to enable extra data to pass to a graphics device when using devices based upon devout.
What’s in the box
encode_robj_to_bytes()/decode_bytes_to_robjencode an arbitrary R object to bytes usingbase::serialize(). This will also compress the data if zstdlite is installed.encode_robj_to_png()/decode_png_to_robjencode an arbitrary R object as a pngencode_robj_to_raster()/decode_raster_to_robjencode as a raster imageencode_robj_to_rasterGrob()/decode_rasterGrob_to_robj()encode as agrid::rasterGrob()object
Installation
You can install from GitHub with:
# install.package('remotes')
remotes::install_github('coolbutuseless/zstdlite') # suggested. but not mandatory.
remotes::install_github('coolbutuseless/snowcrash')
Encoding a small vector as bytes
bytes <- encode_robj_to_bytes(c(1, 2, 3))
bytes
[1] 5a 53 54 18 28 b5 2f fd 20 37 a5 01 00 74 02 58 0a 00 00 00 03 00 04 00 02
[26] 00 03 05 00 00 00 00 05 55 54 46 2d 38 00 00 00 0e 3f f0 00 00 40 08 00 00
[51] 00 00 00 00 04 04 01 2b 00 65 dc c4 f3 1c 03decode_bytes_to_robj(bytes)[1] 1 2 3Encoding a data.frame as an Image Raster
This example encodes the head of the mtcars data.frame into a raster image.
ras <- encode_robj_to_raster(head(mtcars), alpha = 1)
head(ras)
[,1] [,2] [,3] [,4] [,5] [,6]
[1,] "#5A550CFF" "#0064BDFF" "#5260D0FF" "#104EE6FF" "#5EE176FF" "#9D371CFF"
[2,] "#53C640FF" "#364065FF" "#5AD887FF" "#4BE71CFF" "#8C98EBFF" "#9A32C1FF"
[3,] "#543F18FF" "#1341E5FF" "#68CB46FF" "#C1EDF4FF" "#5E92DDFF" "#6C4279FF"
[4,] "#18834BFF" "#4B1695FF" "#B801FFFF" "#304003FF" "#96D4E9FF" "#6C28A9FF"
[5,] "#28392FFF" "#3E0CE2FF" "#A042E3FF" "#62B7B9FF" "#C7939FFF" "#014293FF"
[6,] "#B54CE0FF" "#207639FF" "#C0F068FF" "#8AC390FF" "#16DA0DFF" "#FD4B12FF"
[,7] [,8] [,9] [,10] [,11] [,12]
[1,] "#24FF9CFF" "#32FEC7FF" "#B8A9D0FF" "#7F886CFF" "#FB2A00FF" "#904700FF"
[2,] "#3CEEF6FF" "#598FA3FF" "#306627FF" "#C7187CFF" "#7F1600FF" "#508100FF"
[3,] "#36DBAEFF" "#D465DBFF" "#688F62FF" "#FF4D3FFF" "#4E0100FF" "#906D00FF"
[4,] "#001585FF" "#23DFA5FF" "#E1C85BFF" "#EFA33BFF" "#7BD600FF" "#3F1100FF"
[5,] "#40FF8EFF" "#8A10A0FF" "#C276E1FF" "#BFBBE6FF" "#F62C00FF" "#131500FF"
[6,] "#00B355FF" "#F6A58AFF" "#A1C042FF" "#84B1DEFF" "#EDA500FF" "#2E5400FF"
[,13]
[1,] "#7DA000FF"
[2,] "#DCC800FF"
[3,] "#922500FF"
[4,] "#A8F000FF"
[5,] "#340200FF"
[6,] "#242900FF"plot(ras, interpolate = FALSE)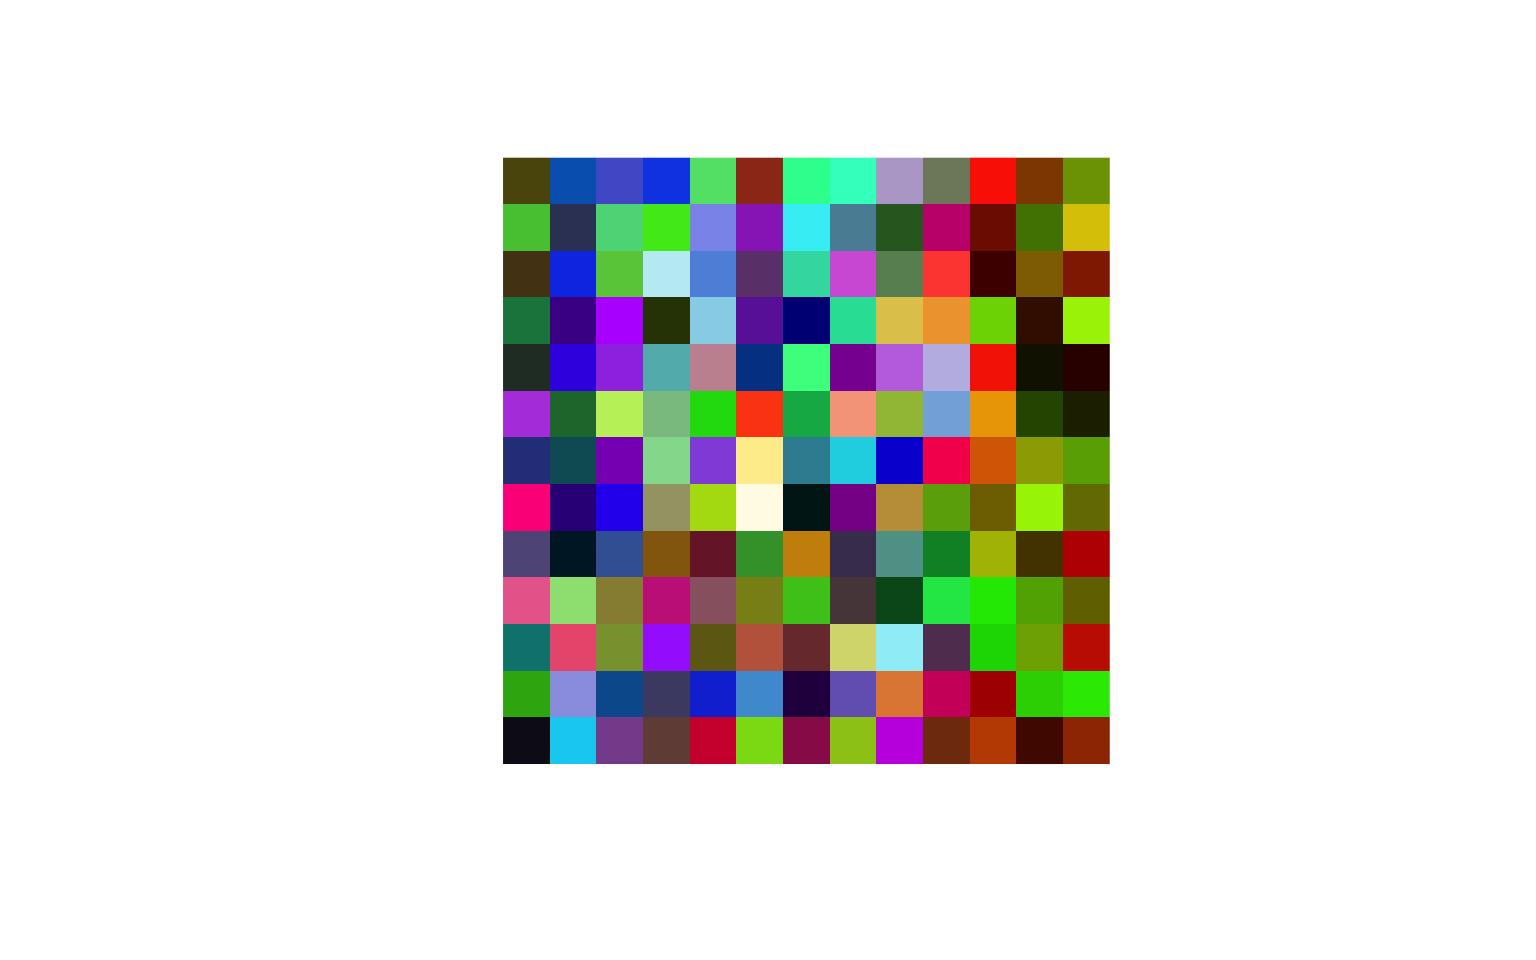
decode_raster_to_robj(ras) mpg cyl disp hp drat wt qsec vs am gear carb
Mazda RX4 21.0 6 160 110 3.90 2.620 16.46 0 1 4 4
Mazda RX4 Wag 21.0 6 160 110 3.90 2.875 17.02 0 1 4 4
Datsun 710 22.8 4 108 93 3.85 2.320 18.61 1 1 4 1
Hornet 4 Drive 21.4 6 258 110 3.08 3.215 19.44 1 0 3 1
Hornet Sportabout 18.7 8 360 175 3.15 3.440 17.02 0 0 3 2
Valiant 18.1 6 225 105 2.76 3.460 20.22 1 0 3 1Encoding a Function as a grid::rasterGrob()
This example encodes the rle() function into a rasterGrob() object.
raster_grob <- encode_robj_to_rasterGrob(rle, alpha = 1)
grid::grid.draw(raster_grob)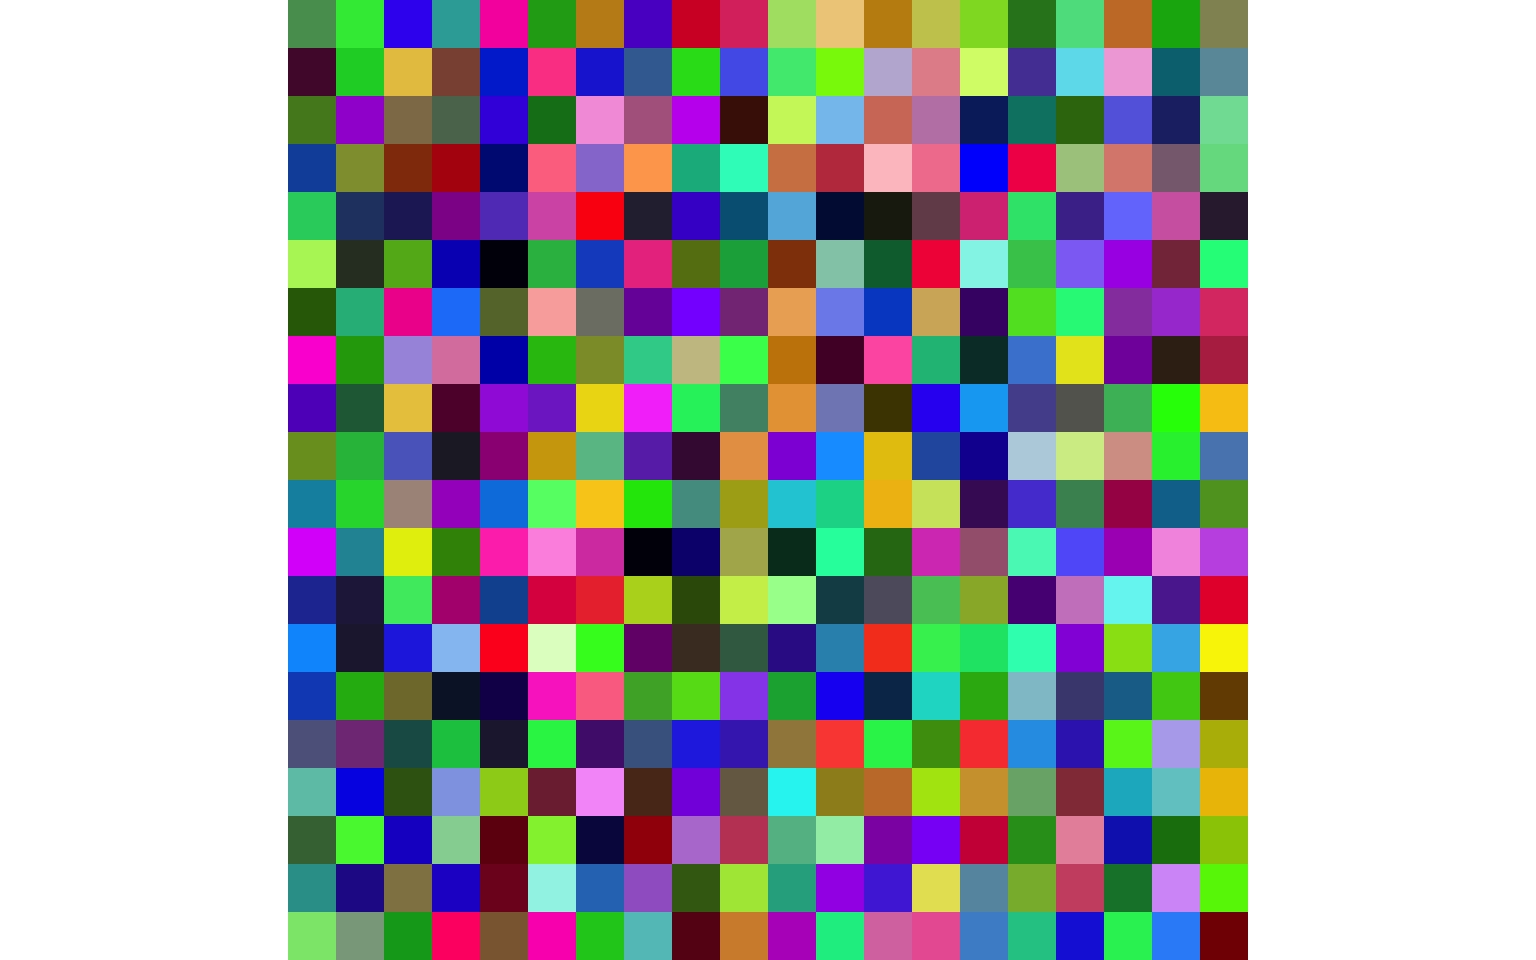
decode_rasterGrob_to_robj(raster_grob)function (x)
{
if (!is.vector(x) && !is.list(x))
stop("'x' must be a vector of an atomic type")
n <- length(x)
if (n == 0L)
return(structure(list(lengths = integer(), values = x),
class = "rle"))
y <- x[-1L] != x[-n]
i <- c(which(y | is.na(y)), n)
structure(list(lengths = diff(c(0L, i)), values = x[i]),
class = "rle")
}
<bytecode: 0x7fe06c1e3bf0>
<environment: namespace:base>Encoding a ggplot2 Object as a PNG image
This example encodes a full ggplot code object in a PNG image file.
#~~~~~~~~~~~~~~~~~~~~~~~~~~~~~~~~~~~~~~~~~~~~~~~~~~~~~~~~~~~~~~~~~~~~~~~~~~~~~
# Create a plot ojbect
#~~~~~~~~~~~~~~~~~~~~~~~~~~~~~~~~~~~~~~~~~~~~~~~~~~~~~~~~~~~~~~~~~~~~~~~~~~~~~
library(ggplot2)
p <- ggplot(mtcars) +
  geom_point(aes(mpg, wt))


#~~~~~~~~~~~~~~~~~~~~~~~~~~~~~~~~~~~~~~~~~~~~~~~~~~~~~~~~~~~~~~~~~~~~~~~~~~~~~
# Save the ggplot2 object as a PNG image
#~~~~~~~~~~~~~~~~~~~~~~~~~~~~~~~~~~~~~~~~~~~~~~~~~~~~~~~~~~~~~~~~~~~~~~~~~~~~~
png_file <- "/tmp/test.png"
encode_robj_to_png(p, filename = png_file, alpha = 1)
p <- decode_png_to_robj("/tmp/test.png")

p +
  theme_bw() +
  labs(title = "Decoded plot object")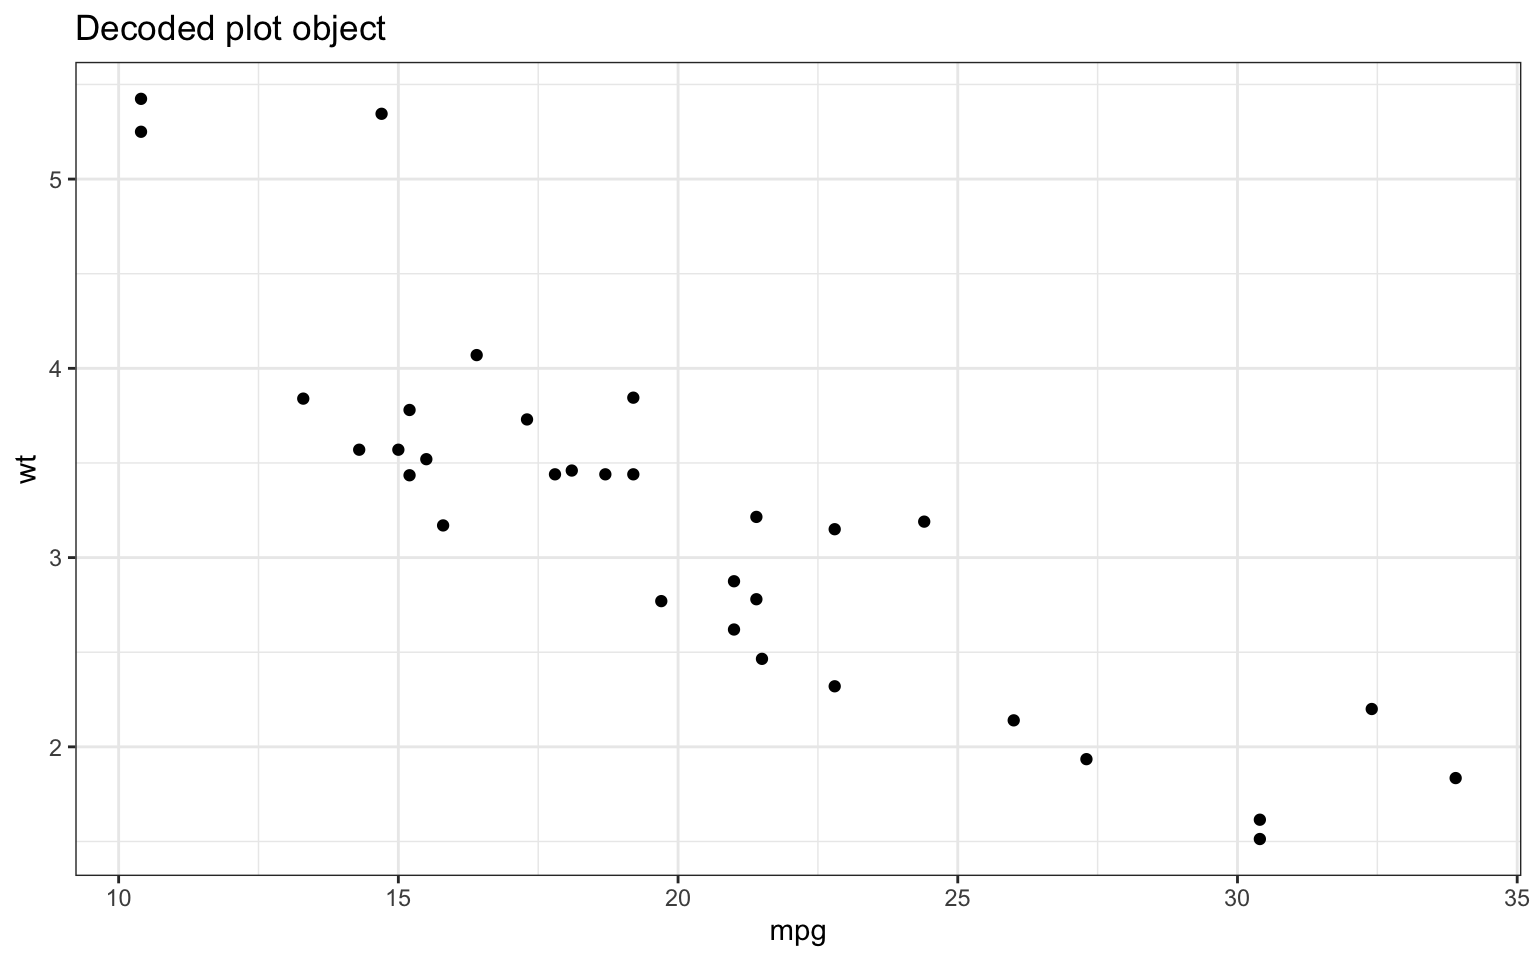
snowcrash - by Neal Stephenson
This package is named after Snow Crash, a sci-fi book by Neal Stephenson where events are set in motion by someone viewing an image of encoded information.
“You saw the whole thing,” Da5id says. “A fixed pattern of black-and-white pixels, fairly high-resolution. Just a few hundred thousand ones and zeroes for me to look at.”
“So in other words, someone just exposed your optic nerve to what, maybe a hundred thousand bytes of information,” Hiro says.
“Noise, is more like it.”
“Well, all information looks like noise until you break the code,” Hiro says.
“Why would anyone show me information in binary code? I’m not a computer. I can’t read a bitmap.”
Acknowledgements
- R Core for developing and maintaining the language.
- CRAN maintainers, for patiently shepherding packages onto CRAN and maintaining the repository