ggqr
![]()
ggqr provides geom_qr() for inserting QR Codes into a plot.
The core QR functionality is provided by Bob Rudis’s qrencoder package.
What’s in the box
geom_qr()to add QR codes to a plotgrGrob()to create a QR grob
Future Possibilities?
- Add automatic label positioning to avoid overlap of codes
Installation
You can install from GitHub with:
# install.package('remotes')
remotes::install_github('coolbutuseless/ggqr')
Example
library(ggplot2)
library(ggqr)

plot_df       <- head(mtcars)
plot_df$car   <- paste0("https://duckduckgo.com/?q=", rownames(plot_df))
plot_df$hjust <- c(-0.1, 1.1, 1.1, -0.1,   0,   0)
plot_df$vjust <- c( 1.1, 0.0, 0.0, -0.1, 1.1, 1.1)

ggplot(plot_df) +
  geom_qr(
    aes(
      x     = mpg,
      y     = wt,
      label = car,
      hjust = I(hjust),
      vjust = I(vjust),
      col   = as.factor(cyl)
    ),
    size = 0.8
  ) +
  geom_point(aes(mpg, wt), size = 3) +
  theme_bw() +
  theme(legend.position = 'bottom') +
  labs(title = "ggqr::geom_qr() - QR codes with search links to car names")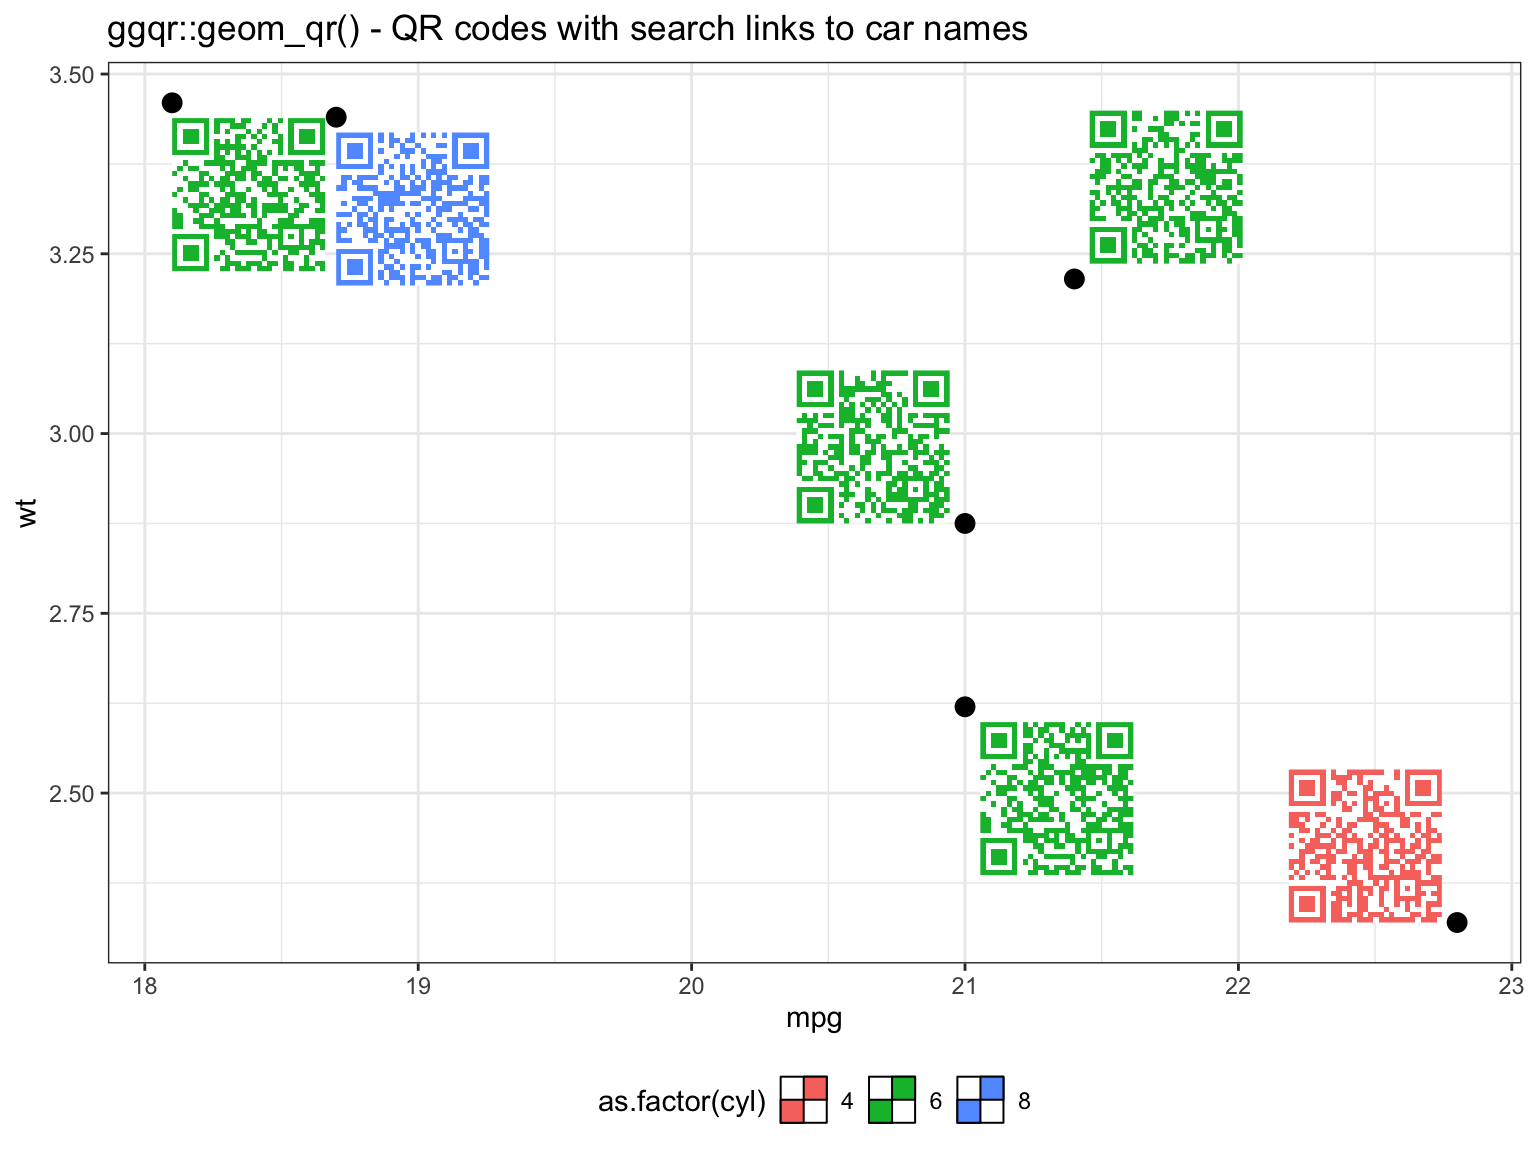
Acknowledgements
- R Core for developing and maintaining the language.
- CRAN maintainers, for patiently shepherding packages onto CRAN and maintaining the repository