- I wanted to calculate some points along cubic bezier curves
- Current R grid bezier implementation is not a real bezier! According to docs
for
grid::bezierGrob(): “The curve is currently drawn using an approximation based on X-splines.”
- Code below is the fastest thing I could come up with (I’m only 80% sure it’s correct)
- It vectorized implemntation of the explicit form of the curve
as explained on Wikipedia
- I need something that can quickly change between low-complexity and
high-complexity approximations to the curve by changing the number of
line segments generated
- Speed-ups welcomed
Code
#~~~~~~~~~~~~~~~~~~~~~~~~~~~~~~~~~~~~~~~~~~~~~~~~~~~~~~~~~~~~~~~~~~~~~~~~~~~~~
# Pre-calculate sets of control-point weights for each for a range of
# different desired points in the output
#~~~~~~~~~~~~~~~~~~~~~~~~~~~~~~~~~~~~~~~~~~~~~~~~~~~~~~~~~~~~~~~~~~~~~~~~~~~~~
bf3s <- lapply(1:100, function(N) {
  t  <- seq.int(0, 1, length.out = N)

  matrix(c(
    1 * t^0 * (1 - t)^3,
    3 * t^1 * (1 - t)^2,
    3 * t^2 * (1 - t)^1,
    1 * t^3 * (1 - t)^0
  ), ncol = 4
  )
})


#~~~~~~~~~~~~~~~~~~~~~~~~~~~~~~~~~~~~~~~~~~~~~~~~~~~~~~~~~~~~~~~~~~~~~~~~~~~~~
#' Convert cubic  beziers to data.frame of coordinates along curve
#'
#' @param x,y coords of control points
#' @param N Number of output points
#'
#' @return list of coords
#~~~~~~~~~~~~~~~~~~~~~~~~~~~~~~~~~~~~~~~~~~~~~~~~~~~~~~~~~~~~~~~~~~~~~~~~~~~~~
bezier3 <- function(x, y, N = 5) {
  stopifnot(length(x)== 4, length(y) == 4)
  list(
    x = rowSums(bf3s[[N]] * matrix(x, nrow = N, ncol = 4, byrow = TRUE)),
    y = rowSums(bf3s[[N]] * matrix(y, nrow = N, ncol = 4, byrow = TRUE))
  )
}
Demo
library(grid)
# Random control points
set.seed(1)
xcp <- runif(4)
ycp <- runif(4)
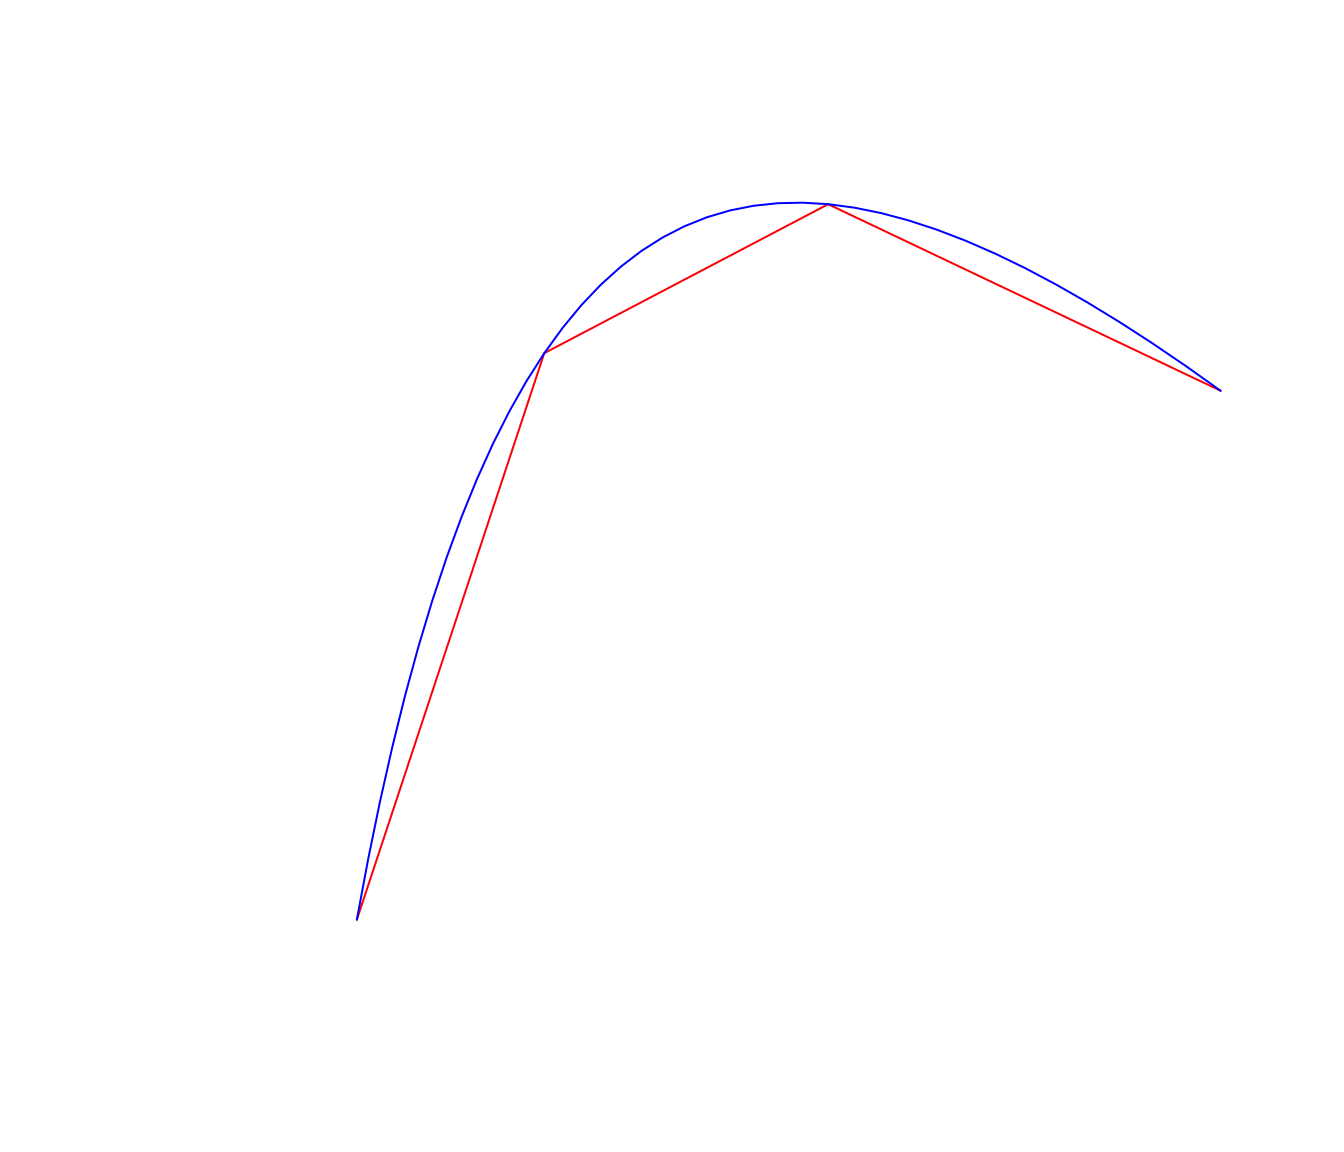
# Generate low and high complexity approximations
pt_lo <- bezier3(xcp, ycp, 4)
pt_hi <- bezier3(xcp, ycp, 40)
# Draw my approximations
grid.lines(pt_lo$x, pt_lo$y, gp = gpar(col = 'red' ))
grid.lines(pt_hi$x, pt_hi$y, gp = gpar(col = 'blue'))
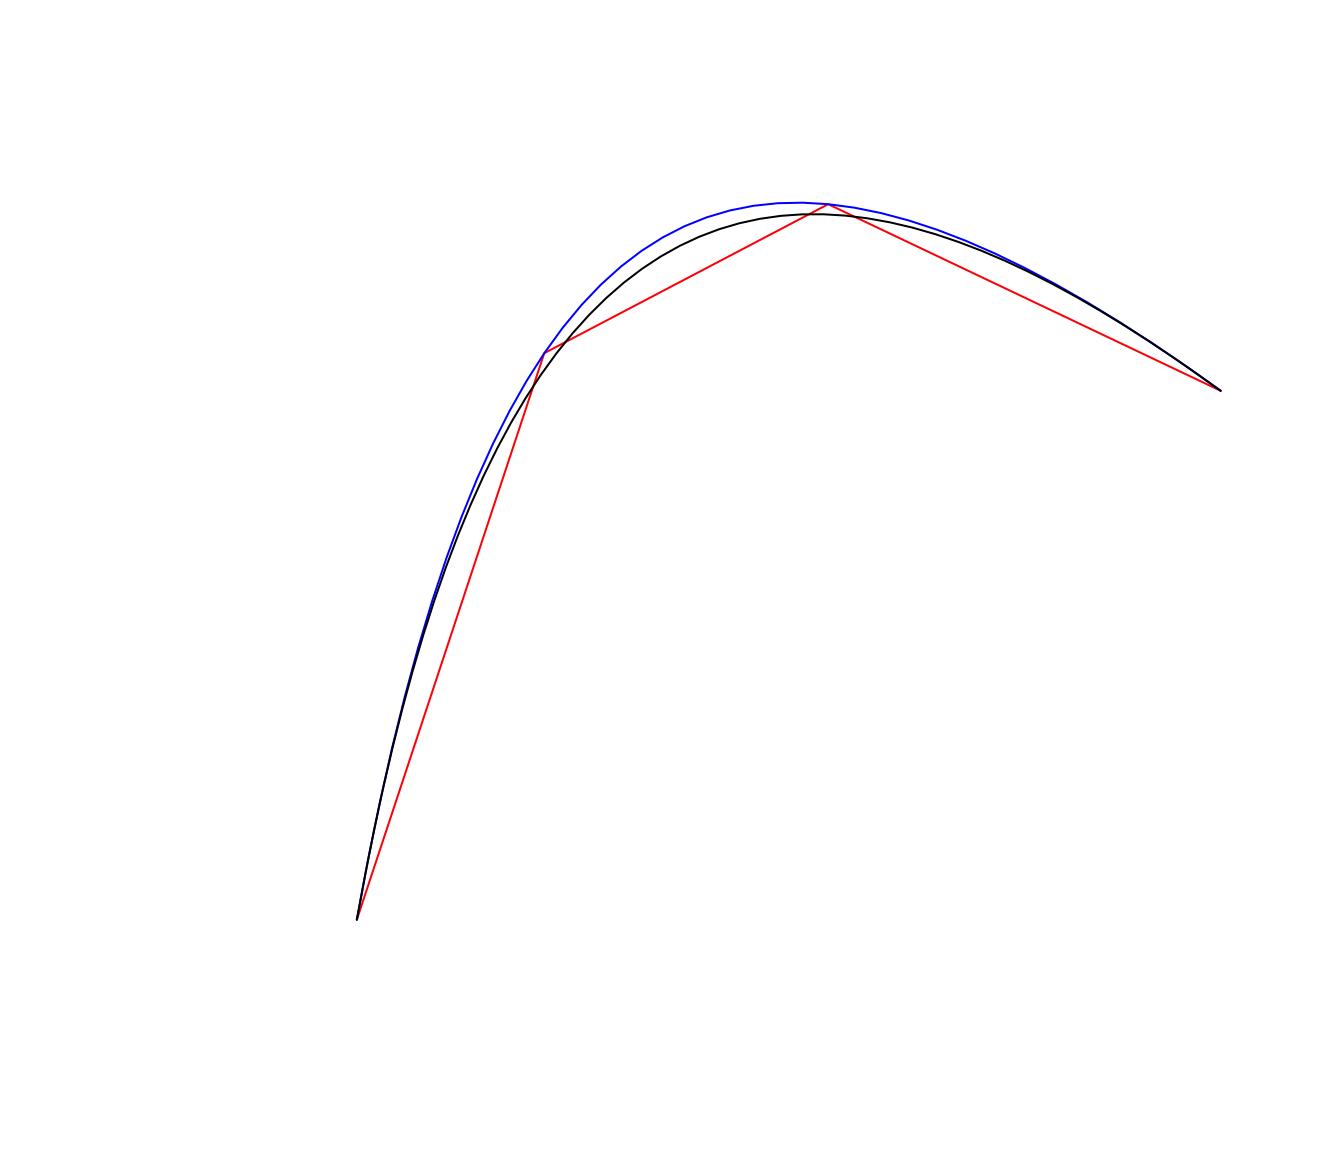
Comparison to grid::grid.bezier()
# Overlay the grid version of this bezier
grid.lines(pt_lo$x, pt_lo$y, gp = gpar(col = 'red' ))
grid.lines(pt_hi$x, pt_hi$y, gp = gpar(col = 'blue'))
grid.bezier(xcp, ycp)
Benchmark
- About 30,000 beziers/second
| bezier3(xcp, ycp, N) |
5 |
22.4µs |
26.9µs |
35103.10 |
| bezier3(xcp, ycp, N) |
10 |
22.3µs |
27.5µs |
31933.63 |
| bezier3(xcp, ycp, N) |
20 |
22.7µs |
27.8µs |
33358.24 |
| bezier3(xcp, ycp, N) |
50 |
24µs |
30.5µs |
30847.32 |
| bezier3(xcp, ycp, N) |
100 |
27µs |
33µs |
27591.29 |