library(ggplot2)
library(grid)
library(gggrid)
Use grobs as points in {ggplot} using {gggrid}
I highly recommend reading Paul Murrel’s Report on {gggrid} and other techniques for getting grobs into ggplots.
# remotes::install_github('https://github.com/pmur002/gggrid')
library(grid)
library(gggrid)
hex <- FALSE
if (hex) {
#~~~~~~~~~~~~~~~~~~~~~~~~~~~~~~~~~~~~~~~~~~~~~~~~~~~~~~~~~~~~~~~~~~~~~~~~~~~~~
# Create the template grob - a hex!
#~~~~~~~~~~~~~~~~~~~~~~~~~~~~~~~~~~~~~~~~~~~~~~~~~~~~~~~~~~~~~~~~~~~~~~~~~~~~~
r <- 0.5
theta <- seq(30, 360, 60) * pi/180
x <- r * cos(theta)
y <- r * sin(theta)
g <- grid::polygonGrob(x = x, y = y, vp = viewport(), gp = gpar())
} else {
#~~~~~~~~~~~~~~~~~~~~~~~~~~~~~~~~~~~~~~~~~~~~~~~~~~~~~~~~~~~~~~~~~~~~~~~~~~~~~
# Create the template grob - a 5 pointed star
#~~~~~~~~~~~~~~~~~~~~~~~~~~~~~~~~~~~~~~~~~~~~~~~~~~~~~~~~~~~~~~~~~~~~~~~~~~~~~
r <- 0.5
theta <- seq(36, 360, 72) * pi/180
x <- r * cos(theta)
y <- r * sin(theta)
g <- grid::polygonGrob(x = x[c(1,3,5,2,4)], y = y[c(1,3,5,2,4)], vp = viewport(), gp = gpar())
}
#~~~~~~~~~~~~~~~~~~~~~~~~~~~~~~~~~~~~~~~~~~~~~~~~~~~~~~~~~~~~~~~~~~~~~~~~~~~~~
# Define the callback function to use within each panel.
# See https://www.stat.auckland.ac.nz/~paul/Reports/gggrid/gggrid.html
#
# @param data data.frame of original data
# @param coords data.frame of values scaled to fit into the desired output units
# as well as any aesthetic values.
# One row per point.
#~~~~~~~~~~~~~~~~~~~~~~~~~~~~~~~~~~~~~~~~~~~~~~~~~~~~~~~~~~~~~~~~~~~~~~~~~~~~~
panel_func <- function(data, coords) {
# Function which will be called for each row in 'coords'
position_grob <- function(point) {
gnew <- g
gnew$gp$fill <- point$fill
gnew$gp$col <- NA #point$colour
gnew$gp$alpha <- point$alpha
gnew$vp$x <- unit(point[['x']], 'npc')
gnew$vp$y <- unit(point[['y']], 'npc')
gnew$vp$width <- unit(point[['size']]/4, 'cm')
gnew$vp$height <- unit(point[['size']]/4, 'cm')
gnew$name <- strftime(Sys.time(), "%H%M%OS6") # Enforce unique name per grob.
gnew
}
# For each point, generate a grob
grobs <- lapply(
seq(nrow(coords)),
function(idx) {
position_grob(coords[idx, ])
})
# group all the point grobs into a single grobTree object
do.call(grid::grobTree, grobs)
}
#~~~~~~~~~~~~~~~~~~~~~~~~~~~~~~~~~~~~~~~~~~~~~~~~~~~~~~~~~~~~~~~~~~~~~~~~~~~~~
# Plot wih a `gggrid::grid_panel()`
#~~~~~~~~~~~~~~~~~~~~~~~~~~~~~~~~~~~~~~~~~~~~~~~~~~~~~~~~~~~~~~~~~~~~~~~~~~~~~
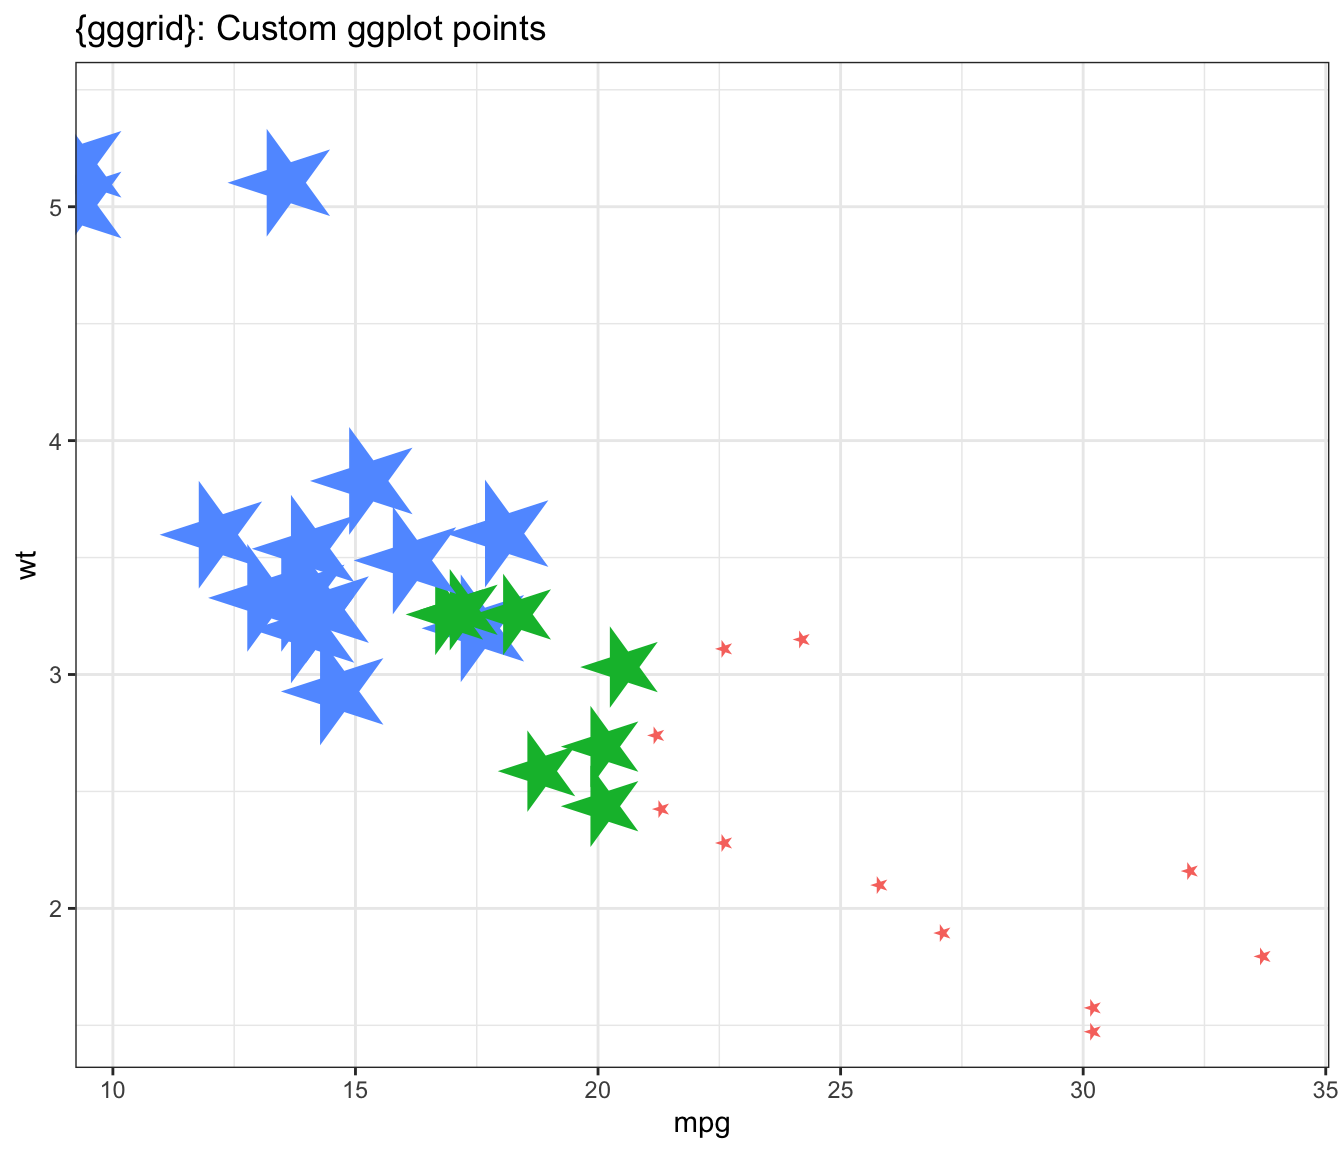
ggplot(
data = mtcars,
mapping = aes(
x = mpg,
y = wt,
size = cyl,
fill = as.factor(cyl)
)
) +
gggrid::grid_panel(panel_func) +
theme_bw() +
labs(title = "{gggrid}: Custom ggplot points")