Basic Chipmunk
This demo:
- Creates a new
Chipmunkobject - Adds some static segments and circles
- View the state of the simulation
- Advance the state of the simulation
- View the updated state of the simulation
library(chipmunkbasic)
library(ggplot2)
set.seed(1)

#~~~~~~~~~~~~~~~~~~~~~~~~~~~~~~~~~~~~~~~~~~~~~~~~~~~~~~~~~~~~~~~~~~~~~~~~~~~~~
# Initialize a simulation space
#~~~~~~~~~~~~~~~~~~~~~~~~~~~~~~~~~~~~~~~~~~~~~~~~~~~~~~~~~~~~~~~~~~~~~~~~~~~~~
cm <- Chipmunk$new()


#~~~~~~~~~~~~~~~~~~~~~~~~~~~~~~~~~~~~~~~~~~~~~~~~~~~~~~~~~~~~~~~~~~~~~~~~~~~~~
# Add fixed segments
#~~~~~~~~~~~~~~~~~~~~~~~~~~~~~~~~~~~~~~~~~~~~~~~~~~~~~~~~~~~~~~~~~~~~~~~~~~~~~
cm$add_static_segment(-20, 10, -5, 0)
cm$add_static_segment( 20, 10,  5, 0)

#~~~~~~~~~~~~~~~~~~~~~~~~~~~~~~~~~~~~~~~~~~~~~~~~~~~~~~~~~~~~~~~~~~~~~~~~~~~~~
# Fetch all the segments. Use for plotting
#~~~~~~~~~~~~~~~~~~~~~~~~~~~~~~~~~~~~~~~~~~~~~~~~~~~~~~~~~~~~~~~~~~~~~~~~~~~~~
segments_df <- cm$get_static_segments()

#~~~~~~~~~~~~~~~~~~~~~~~~~~~~~~~~~~~~~~~~~~~~~~~~~~~~~~~~~~~~~~~~~~~~~~~~~~~~~
# Add some circles
#~~~~~~~~~~~~~~~~~~~~~~~~~~~~~~~~~~~~~~~~~~~~~~~~~~~~~~~~~~~~~~~~~~~~~~~~~~~~~
for (i in 1:10) {
  cm$add_circle(
    x = runif(1, -20, 20),
    y = runif(1,  10, 50),
    vx = 10 * rnorm(1),
    vy = 10 * rnorm(1)
  )
}

#~~~~~~~~~~~~~~~~~~~~~~~~~~~~~~~~~~~~~~~~~~~~~~~~~~~~~~~~~~~~~~~~~~~~~~~~~~~~~
# Get the current positions of the circles as a data.frame
#~~~~~~~~~~~~~~~~~~~~~~~~~~~~~~~~~~~~~~~~~~~~~~~~~~~~~~~~~~~~~~~~~~~~~~~~~~~~~
circles <- cm$get_circles()
circles
#> idx x y vx vy fx fy theta omega torque r
#> 1 1 -9.3796535 24.88496 1.8364332 -8.356286 0 0 0 0 0 1
#> 2 2 17.7870107 36.43191 3.2950777 -8.204684 0 0 0 0 0 1
#> 3 3 7.4809139 25.36415 7.3832471 5.757814 0 0 0 0 0 1
#> 4 4 -4.7985928 41.09781 15.1178117 3.898432 0 0 0 0 0 1
#> 5 5 -9.3111733 25.44456 -22.1469989 11.249309 0 0 0 0 0 1
#> 6 6 -0.7167954 33.98263 -0.1619026 9.438362 0 0 0 0 0 1
#> 7 7 11.7695944 14.31775 5.9390132 9.189774 0 0 0 0 0 1
#> 8 8 11.3173105 32.12145 0.7456498 -19.893517 0 0 0 0 0 1
#> 9 9 9.2925495 37.70926 -0.5612874 -1.557955 0 0 0 0 0 1
#> 10 10 -17.1728381 13.97865 -4.7815006 4.179416 0 0 0 0 0 1
#~~~~~~~~~~~~~~~~~~~~~~~~~~~~~~~~~~~~~~~~~~~~~~~~~~~~~~~~~~~~~~~~~~~~~~~~~~~~~
# Advance the simulation
#~~~~~~~~~~~~~~~~~~~~~~~~~~~~~~~~~~~~~~~~~~~~~~~~~~~~~~~~~~~~~~~~~~~~~~~~~~~~~
cm$advance(10)
#~~~~~~~~~~~~~~~~~~~~~~~~~~~~~~~~~~~~~~~~~~~~~~~~~~~~~~~~~~~~~~~~~~~~~~~~~~~~~
# Show me the circles in their new locations
#~~~~~~~~~~~~~~~~~~~~~~~~~~~~~~~~~~~~~~~~~~~~~~~~~~~~~~~~~~~~~~~~~~~~~~~~~~~~~
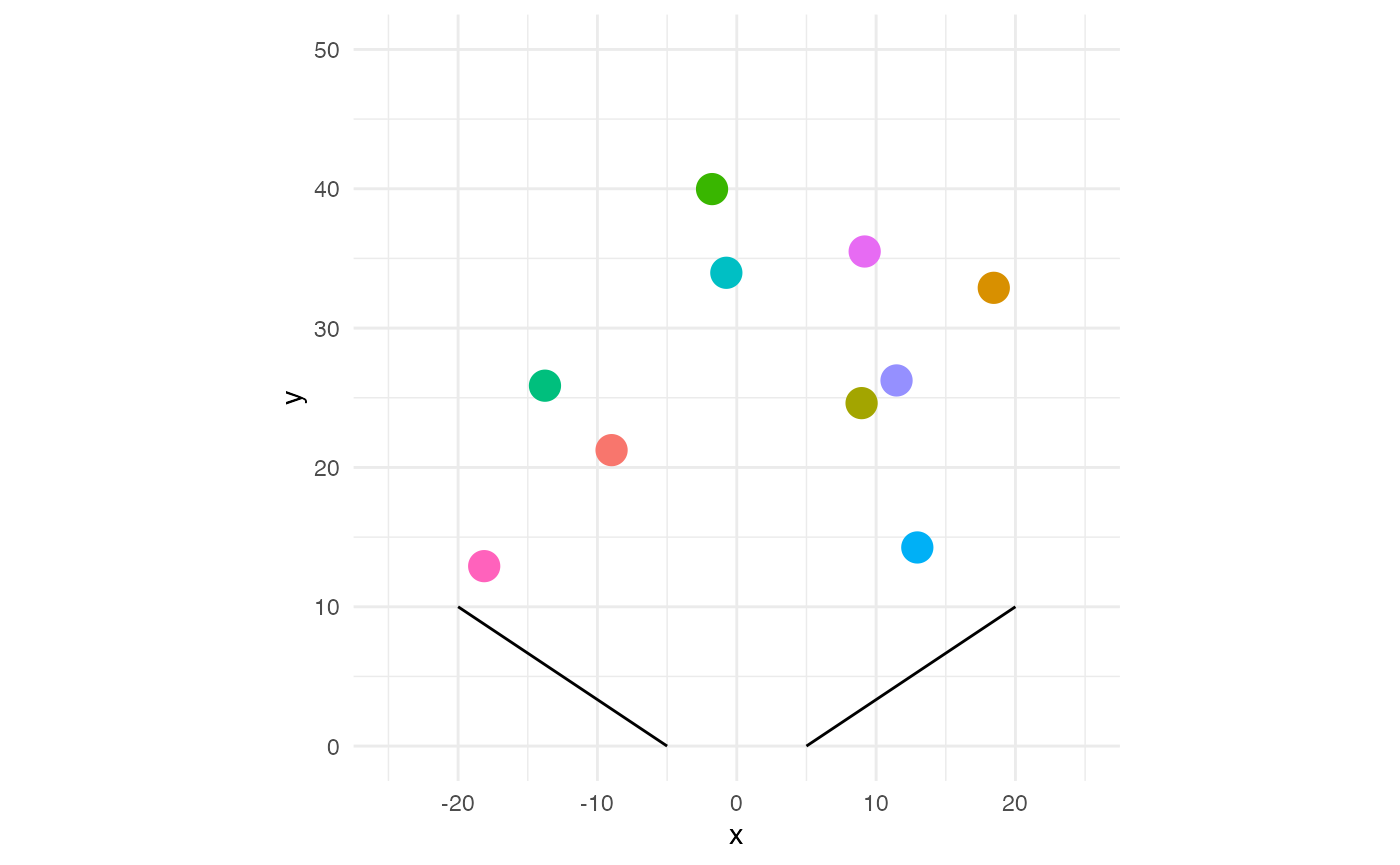
circles <- cm$get_circles()
circles#> idx x y vx vy fx fy theta omega
#> 1 1 -9.1697635 23.52691 1.8364332 -18.3562861 0 0 -4.440892e-18 0
#> 2 2 18.1165185 35.16144 3.2950777 -18.2046838 0 0 0.000000e+00 0
#> 3 3 8.2192386 25.48993 7.3832471 -4.2421865 0 0 0.000000e+00 0
#> 4 4 -3.2868117 41.03765 15.1178117 -6.1015676 0 0 0.000000e+00 0
#> 5 5 -11.5521198 26.19191 -22.1469989 1.2493092 0 0 -4.440892e-18 0
#> 6 6 -0.7329856 34.47647 -0.1619026 -0.5616379 0 0 0.000000e+00 0
#> 7 7 12.3634958 14.78672 5.9390132 -0.8102263 0 0 0.000000e+00 0
#> 8 8 11.3918755 29.68210 0.7456498 -29.8935170 0 0 0.000000e+00 0
#> 9 9 9.2364208 37.10347 -0.5612874 -11.5579551 0 0 0.000000e+00 0
#> 10 10 -17.6509882 13.94659 -4.7815006 -5.8205844 0 0 0.000000e+00 0
#> torque r
#> 1 0 1
#> 2 0 1
#> 3 0 1
#> 4 0 1
#> 5 0 1
#> 6 0 1
#> 7 0 1
#> 8 0 1
#> 9 0 1
#> 10 0 1
#~~~~~~~~~~~~~~~~~~~~~~~~~~~~~~~~~~~~~~~~~~~~~~~~~~~~~~~~~~~~~~~~~~~~~~~~~~~~~
# Plot everything
#~~~~~~~~~~~~~~~~~~~~~~~~~~~~~~~~~~~~~~~~~~~~~~~~~~~~~~~~~~~~~~~~~~~~~~~~~~~~~
ggplot(circles) +
  geom_point(aes(x, y, colour = as.factor(idx)), size = 5) +
  geom_segment(data = segments_df, aes(x = x1, y = y1, xend = x2, yend = y2)) +
  coord_fixed(xlim=c(-25, 25), ylim = c(0, 50)) +
  theme_minimal() +
  theme(legend.position = 'none')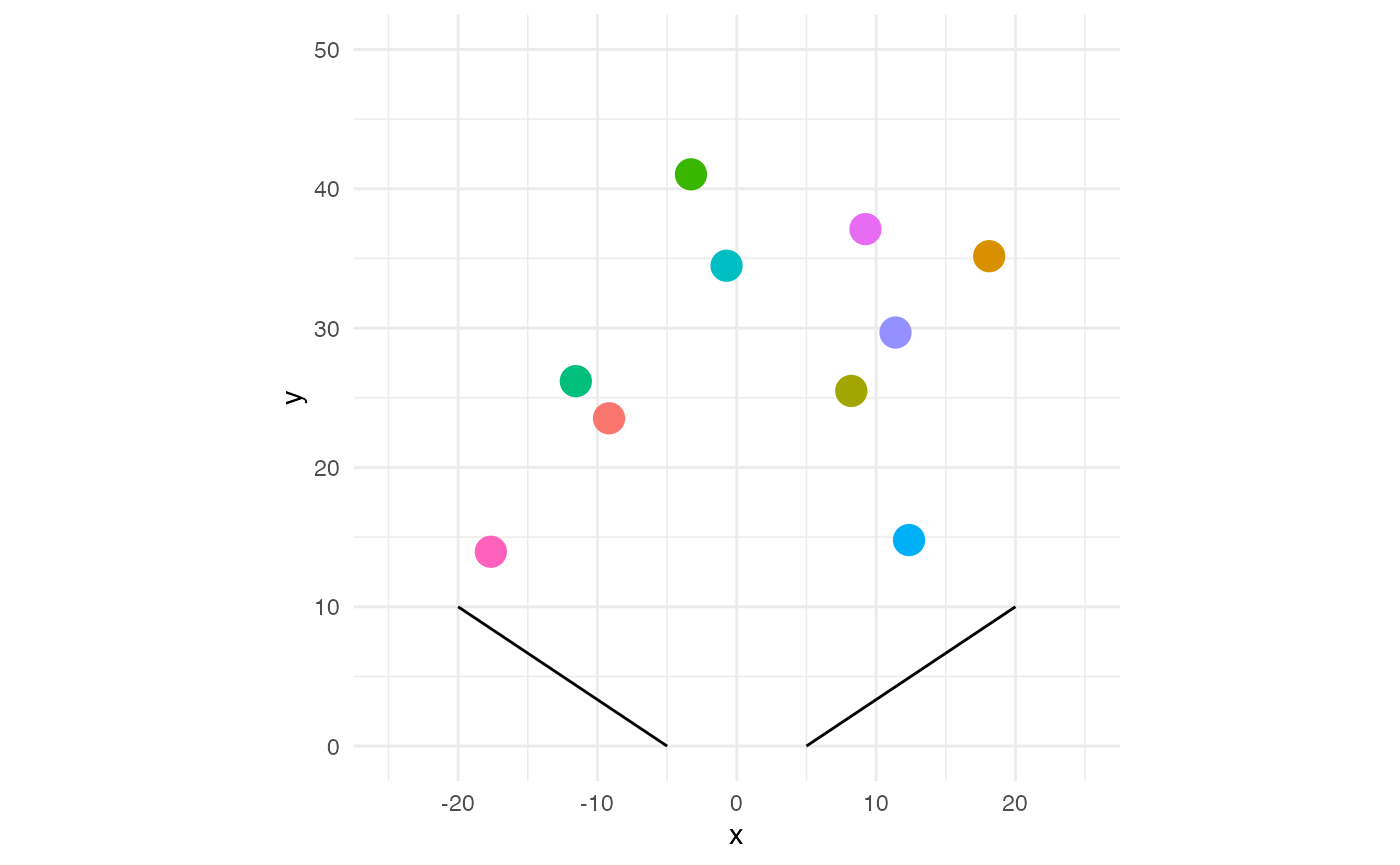
#~~~~~~~~~~~~~~~~~~~~~~~~~~~~~~~~~~~~~~~~~~~~~~~~~~~~~~~~~~~~~~~~~~~~~~~~~~~~~
# Advance the simulation
#~~~~~~~~~~~~~~~~~~~~~~~~~~~~~~~~~~~~~~~~~~~~~~~~~~~~~~~~~~~~~~~~~~~~~~~~~~~~~
cm$advance(10)

#~~~~~~~~~~~~~~~~~~~~~~~~~~~~~~~~~~~~~~~~~~~~~~~~~~~~~~~~~~~~~~~~~~~~~~~~~~~~~
# Show me the circles in their new locations
#~~~~~~~~~~~~~~~~~~~~~~~~~~~~~~~~~~~~~~~~~~~~~~~~~~~~~~~~~~~~~~~~~~~~~~~~~~~~~
circles <- cm$get_circles()
circles
#> idx x y vx vy fx fy theta omega
#> 1 1 -8.9861201 21.24129 1.8364332 -28.356286 0 0 -4.440892e-18 0
#> 2 2 18.4460263 32.89097 3.2950777 -28.204684 0 0 0.000000e+00 0
#> 3 3 8.9575633 24.61571 7.3832471 -14.242186 0 0 0.000000e+00 0
#> 4 4 -1.7750305 39.97750 15.1178117 -16.101568 0 0 0.000000e+00 0
#> 5 5 -13.7668197 25.86684 -22.1469989 -8.750691 0 0 -4.440892e-18 0
#> 6 6 -0.7491759 33.97031 -0.1619026 -10.561638 0 0 0.000000e+00 0
#> 7 7 12.9573971 14.25570 5.9390132 -10.810226 0 0 0.000000e+00 0
#> 8 8 11.4664405 26.24275 0.7456498 -39.893517 0 0 0.000000e+00 0
#> 9 9 9.1802921 35.49767 -0.5612874 -21.557955 0 0 0.000000e+00 0
#> 10 10 -18.1291382 12.91453 -4.7815006 -15.820584 0 0 0.000000e+00 0
#> torque r
#> 1 0 1
#> 2 0 1
#> 3 0 1
#> 4 0 1
#> 5 0 1
#> 6 0 1
#> 7 0 1
#> 8 0 1
#> 9 0 1
#> 10 0 1
#~~~~~~~~~~~~~~~~~~~~~~~~~~~~~~~~~~~~~~~~~~~~~~~~~~~~~~~~~~~~~~~~~~~~~~~~~~~~~
# Plot everything
#~~~~~~~~~~~~~~~~~~~~~~~~~~~~~~~~~~~~~~~~~~~~~~~~~~~~~~~~~~~~~~~~~~~~~~~~~~~~~
ggplot(circles) +
  geom_point(aes(x, y, colour = as.factor(idx)), size = 5) +
  geom_segment(data = segments_df, aes(x = x1, y = y1, xend = x2, yend = y2)) +
  coord_fixed(xlim=c(-25, 25), ylim = c(0, 50)) +
  theme_minimal() +
  theme(legend.position = 'none')