Draw a polyline on a native raster image
nr_polyline(
  nr,
  x,
  y,
  color = "black",
  linewidth = 1,
  mitre_limit = linewidth,
  close = FALSE,
  use_alpha = TRUE
)
Arguments
- nr
native raster image
- x, y
Vectors of point coordinates
- color
Color as a character string. Either a standard R color (e.g. 'blue', 'white') or a hex color of the form
#rrggbbaa,#rrggbb,#rgbaor#rgb- linewidth
Line linewidth. Default: 1. If
linewidth = 1then a naive version of Bresenham is used to draw the points. If linewidth is greater than 1, then the line is convert to a triangle strip and rendered as polygons.- mitre_limit
Limit the size of the mitre when two lines meet at an acute angle and linewidth is greater than 1. Default: same as line linewidth which mostly looks OK.
- close
Should the polyline be closed? I.e. should a line be drawn between the last point and the first point? Default: FALSE
- use_alpha
Use alpha channel when drawing? Logical. Default: TRUE
Value
Invisibly return the supplied native raster image which was been modified in-place
See also
Other drawing functions:
nr_circle(),
nr_polygon(),
nr_rect(),
nr_tri_mesh()
Examples
N <- 20
nr <- nr_new(N, N, 'grey80')
nr_polyline(nr, x = c(0, N-1, 0), y = c(0, 0, N-1), color = 'red')
plot(nr)
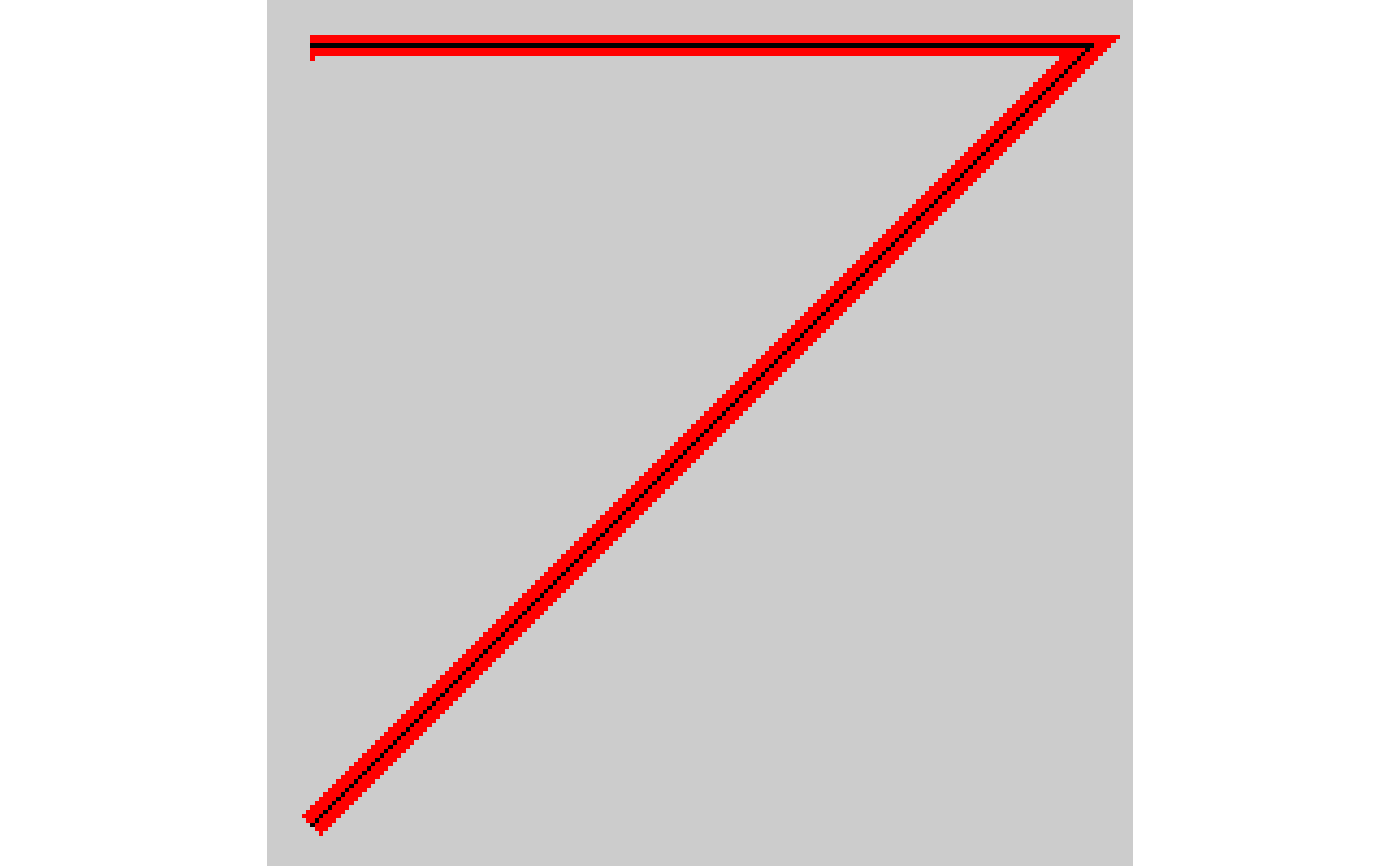
 N <- 200
nr <- nr_new(N, N, 'grey80')
nr_polyline(nr, x = c(10, N-10, 10), y = c(10, 10, N-10), color = 'red',
linewidth = 5, mitre_limit = 3)
nr_polyline(nr, x = c(10, N-10, 10), y = c(10, 10, N-10), color = 'black')
plot(nr)
N <- 200
nr <- nr_new(N, N, 'grey80')
nr_polyline(nr, x = c(10, N-10, 10), y = c(10, 10, N-10), color = 'red',
linewidth = 5, mitre_limit = 3)
nr_polyline(nr, x = c(10, N-10, 10), y = c(10, 10, N-10), color = 'black')
plot(nr)
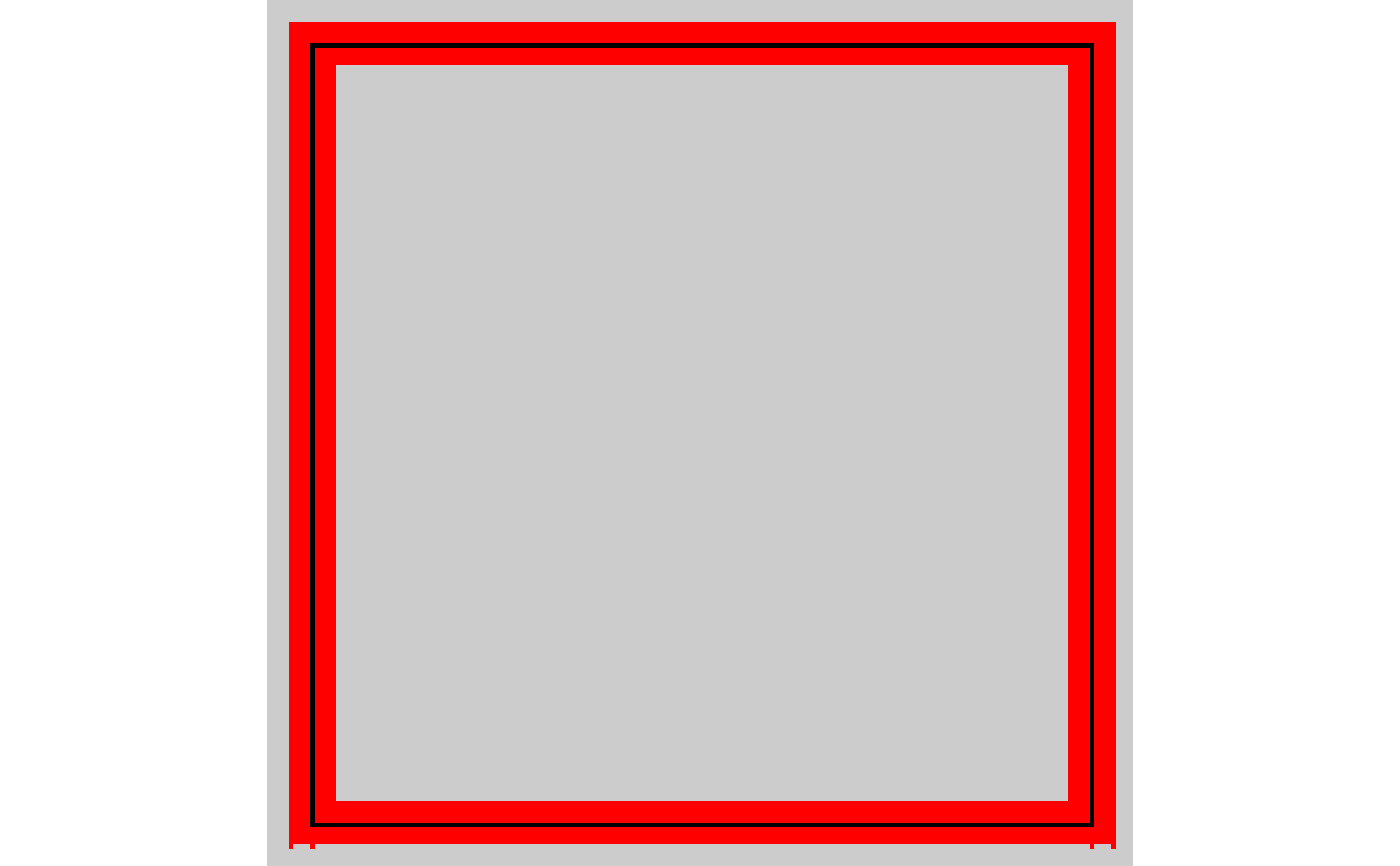
 N <- 200
nr <- nr_new(N, N, 'grey80')
nr_polyline(nr, x = c(10, N-10, N-10, 10), y = c(10, 10, N-10, N-10),
color = 'red', linewidth = 10, mitre_limit = 5, close = TRUE)
nr_polyline(nr, x = c(10, N-10, N-10, 10), y = c(10, 10, N-10, N-10),
color = 'black', close = TRUE)
plot(nr)
N <- 200
nr <- nr_new(N, N, 'grey80')
nr_polyline(nr, x = c(10, N-10, N-10, 10), y = c(10, 10, N-10, N-10),
color = 'red', linewidth = 10, mitre_limit = 5, close = TRUE)
nr_polyline(nr, x = c(10, N-10, N-10, 10), y = c(10, 10, N-10, N-10),
color = 'black', close = TRUE)
plot(nr)