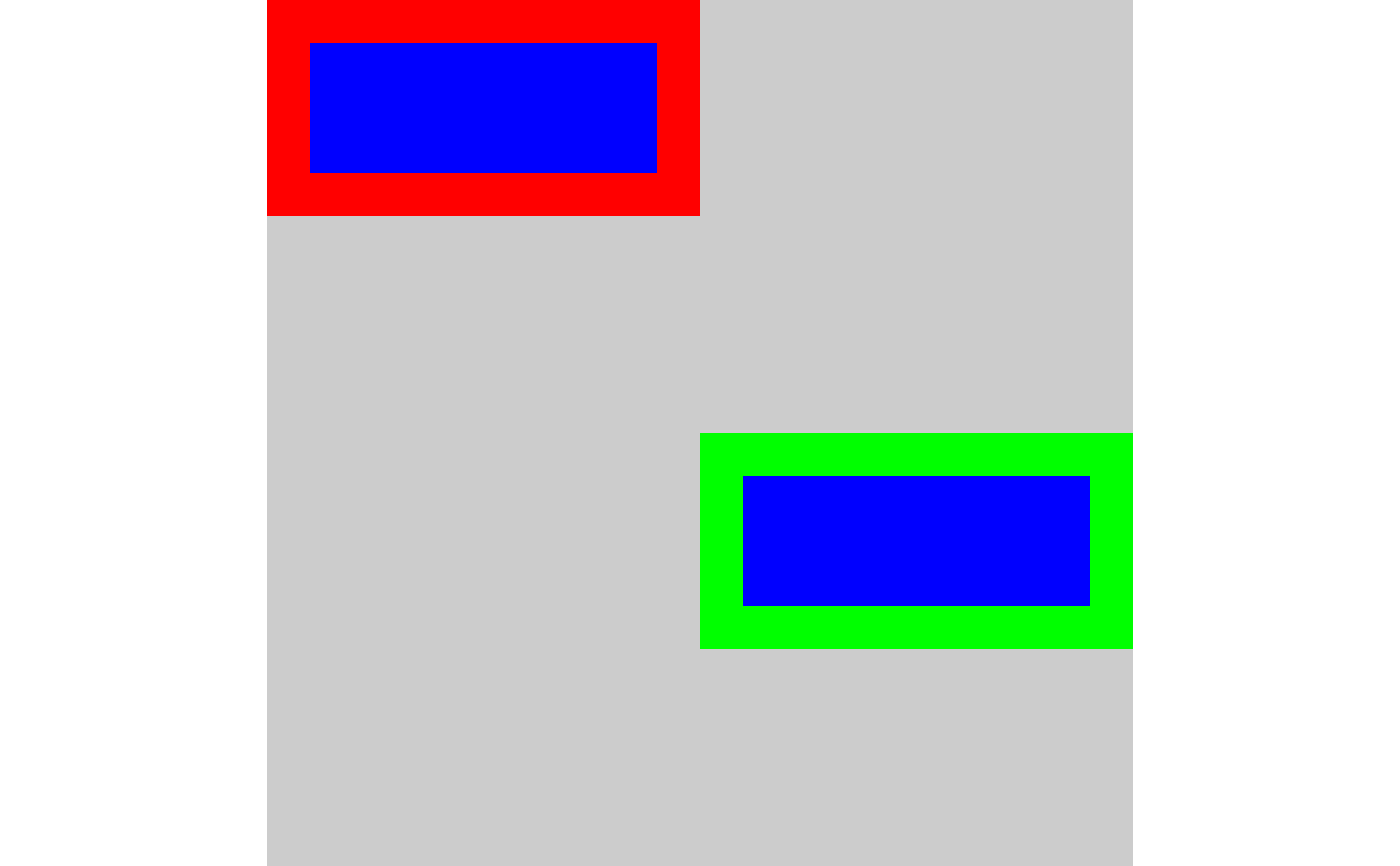
Draw rectangles on a nativeRaster image
nr_rect(
  nr,
  x,
  y,
  w,
  h,
  fill = "black",
  color = NA,
  hjust = 0,
  vjust = 0,
  linewidth = 1
)
Arguments
- nr
nativeRaster- x, y
coordinates of lower left corner of rectangle. [vector]
- w, h
width and height of rectangle. [vector]
- fill
interior fill color [vector]
- color
outline color. Default: NA. [vector]
- hjust, vjust
specify horizontal and vertical justification of the
srcimage. e.g.hjust = vjust = 0the blitting starts at the top-left of the image. Usehjust = vjust = 0.5to treat the centre of thesrc_as the blitting origin. Default (0, 0)- linewidth
Line linewidth. Default: 1. If
linewidth = 1then a naive version of Bresenham is used to draw the points. If linewidth is greater than 1, then the line is convert to a triangle strip and rendered as polygons.
Value
Original nativeRaster modified in-place
