Creating an SVG device - Part 1
creating-an-svg-device-01.RmdIntroduction
This series of vignettes will walk through the process of creating a very basic SVG output device using devout.
The only code to be written is R code. All the tricky C/C++ code is taken care of within devout.
Vignettes in this series:
- This vignette.
- What does the required R function look like?
- What are the arguments?
- Creating a debugging example
- Setting up a ‘canvas’ upon which to write the SVG
- Adding support for device calls which draw on the canvas
- Simple experimentation
library(devout)Overview of the Callback Function
When using the devout output device, instead of passing the drawing calls to some C/C++ code for creating an image, the drawing calls are passed to a nominated R callback function.
This callback function is never called from R, instead when the devout device is initiated we pass in the name of this function. This function is then called from deep within R during the plotting process.
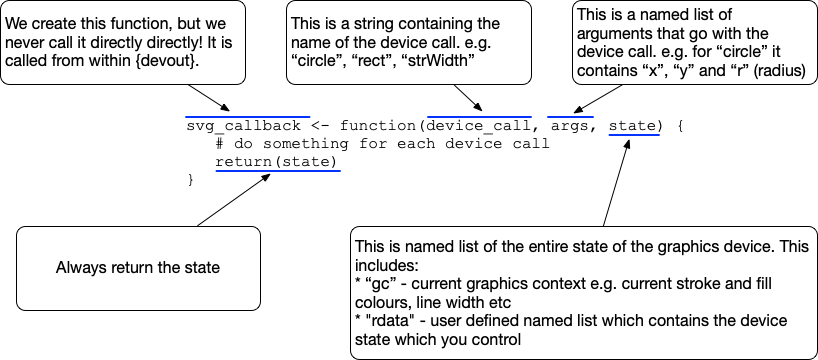
An example of the format of a callback function for use with devout is shown below. Note: this callback doesn’t actual do anything as it returns the state unchanged.
svg_callback <- function(device_call, args, state) {
  # do something for each device call
  return(state)
}
An overview of the callback function is as follows:
The name of the callback function is given to the devout device, and the standard use would look something like the following:
A Simple Callback Function
This section describes the simplest useful callback function.
All this version of the callback function does is print the name of the device call that was requested. There is no attempt at any graphical output or even doing anything in response to the type of call.
#> open  activate
#> holdflush
#> newPage  mode  clip  circle  circle  circle  circle  circle  circle  circle  circle  circle  circle  mode  mode  clip  line  line  line  line  line  line  strWidthUTF8  strWidthUTF8  strWidthUTF8  metricInfo  textUTF8  strWidthUTF8  strWidthUTF8  textUTF8  strWidthUTF8  strWidthUTF8  textUTF8  strWidthUTF8  strWidthUTF8  textUTF8  strWidthUTF8  strWidthUTF8  textUTF8  mode  mode  line  line  line  line  line  line  strWidthUTF8  strWidthUTF8  strWidthUTF8  textUTF8  strWidthUTF8  strWidthUTF8  textUTF8  strWidthUTF8  strWidthUTF8  textUTF8  strWidthUTF8  strWidthUTF8  textUTF8  strWidthUTF8  strWidthUTF8  textUTF8  mode  mode  polygon  mode  mode  clip  strWidthUTF8  textUTF8  strWidthUTF8  textUTF8  mode  holdflush
#> close
Things to note in the output:
- Starts with an
openand ends with aclose - The 10 circles drawn early on - these are the 10 points of the plot
-
strWidthcalls are the R system asking how wide a particular string is rendered in the current state -
textUTF8writes some text to the device
What are all the device calls?
devout includes a data object called devinfo which contains information about R devices.
To see some information about a device call e.g. circle
devinfo$device_call$circle$desc
#> [1] "Draw a circle"

devinfo$device_call$circle$args
#> $x
#> [1] "circle centre x coord [dbl]"
#>
#> $y
#> [1] "circle centre y coord [dbl]"
#>
#> $r
#> [1] "radius [dbl]"
For a list of all the device calls:
names(devinfo$device_call)
#>  [1] "activate"        "cap"             "circle"          "clip"
#>  [5] "close"           "deactivate"      "eventHelper"     "holdflush"
#>  [9] "line"            "locator"         "metricInfo"      "mode"
#> [13] "newFrameConfirm" "newPage"         "onExit"          "path"
#> [17] "polygon"         "polyline"        "raster"          "rect"
#> [21] "size"            "strWidth"        "strWidthUTF8"    "text"
#> [25] "textUTF8"