Use grobs as points in {ggplot} using {gggrid}
I highly recommend reading Paul Murrel’s Report on {gggrid} and other techniques for getting grobs into ggplots.
Other approaches are discussed (e.g. using {egg}) but here I’ll demonstrate using gggrid.
# remotes::install_github('https://github.com/pmur002/gggrid')
library(grid)
library(gggrid)
library(svgparser)
#~~~~~~~~~~~~~~~~~~~~~~~~~~~~~~~~~~~~~~~~~~~~~~~~~~~~~~~~~~~~~~~~~~~~~~~~~~~~~
# Loat SVG as a grob
#~~~~~~~~~~~~~~~~~~~~~~~~~~~~~~~~~~~~~~~~~~~~~~~~~~~~~~~~~~~~~~~~~~~~~~~~~~~~~
rlogo_url <- 'https://www.r-project.org/logo/Rlogo.svg'
g <- svgparser::read_svg(rlogo_url)
g$vp <- grid::viewport(x = 0.8, y = 0.8, width = unit(4, 'cm'), height = unit(4, 'cm'))
#~~~~~~~~~~~~~~~~~~~~~~~~~~~~~~~~~~~~~~~~~~~~~~~~~~~~~~~~~~~~~~~~~~~~~~~~~~~~~
# Define a callfback function to use within each panel.
# See
#~~~~~~~~~~~~~~~~~~~~~~~~~~~~~~~~~~~~~~~~~~~~~~~~~~~~~~~~~~~~~~~~~~~~~~~~~~~~~
func <- function(data, coords) {
position_grob <- function(row) {
gnew <- g
gnew$vp$x <- unit(row[['x']], 'npc')
gnew$vp$y <- unit(row[['y']], 'npc')
gnew$vp$width <- unit(row[['size']]/4, 'cm')
gnew$vp$height <- unit(row[['size']]/4, 'cm')
gnew$name <- strftime(Sys.time(), "%H%M%OS6") # Enforce unique name per grob.
gnew
}
grobs <- lapply(seq(nrow(coords)), function(idx) {position_grob(coords[idx, ])})
do.call(grid::grobTree, grobs)
}
#~~~~~~~~~~~~~~~~~~~~~~~~~~~~~~~~~~~~~~~~~~~~~~~~~~~~~~~~~~~~~~~~~~~~~~~~~~~~~
# Plot wih a `gggrid::grid_panel()`
#~~~~~~~~~~~~~~~~~~~~~~~~~~~~~~~~~~~~~~~~~~~~~~~~~~~~~~~~~~~~~~~~~~~~~~~~~~~~~
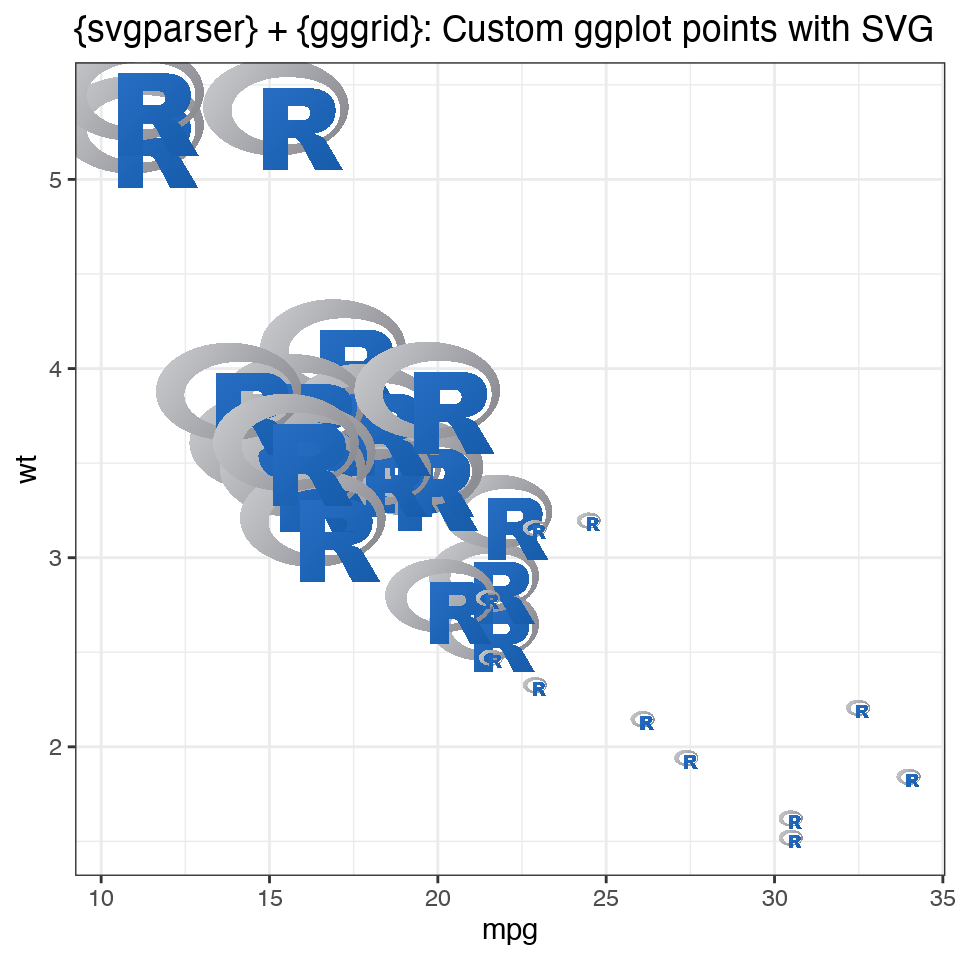
ggplot(mtcars, aes(mpg, wt, size = cyl)) +
grid_panel(func) +
theme_bw() +
labs(title = "{svgparser} + {gggrid}: Custom ggplot points with SVG")