Creating and using a tileable SVG pattern in R grid graphics
Source:vignettes/tileable.Rmd
tileable.RmdCreating a seamless tileable SVG in R and using it as a fill pattern
With R4.1, grid graphics now allows you to set up a repeating tile pattern and use it to fill other objects.
If the tile is seamless (i.e. the edges on top/bottom and left/right align perfectly with no discontinuities), then a large area may be filled with an interesting pattern.
Using packages such as {minisvg} or {omsvg} it is possible to easily create an SVG image wholly within R and use this as a pattern fill for other graphics objects.
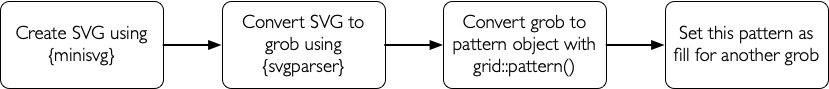
Create SVG using {minisvg}
# remotes::install_github('coolbutuseless/minisvg')
library(minisvg)

# Create SVG document
svg <- minisvg::svg_doc(width = 100, height = 100, fill = '#ECD078')
svg$rect(x = 20, y = 20, width = 60, height = 60, fill = '#542437' , stroke = 'grey70', stroke_width = 10)
svg$rect(x =  5, y =  5, width = 40, height = 40, opacity = 0.8, rx = "20%")
svg$rect(x = 55, y =  5, width = 40, height = 40, opacity = 0.8, rx = "20%")
svg$rect(x =  5, y = 55, width = 40, height = 40, opacity = 0.8, rx = "20%")
svg$rect(x = 55, y = 55, width = 40, height = 40, opacity = 0.8, rx = "20%")

print(svg$as_character())
<svg width="100" height="100" viewBox="0 0 100 100" xmlns="http://www.w3.org/2000/svg" xmlns:xlink="http://www.w3.org/1999/xlink" fill="#ECD078">
  <rect fill="#542437" stroke="#B3B3B3" stroke-width="10" x="20" y="20" width="60" height="60" />
  <rect opacity="0.8" x="5" y="5" width="40" height="40" rx="20%" />
  <rect opacity="0.8" x="55" y="5" width="40" height="40" rx="20%" />
  <rect opacity="0.8" x="5" y="55" width="40" height="40" rx="20%" />
  <rect opacity="0.8" x="55" y="55" width="40" height="40" rx="20%" />
</svg>

# Convert SVG document to a grid graphics object i.e. a 'grob'
g <- read_svg(svg$as_character())
grid.newpage(); grid.draw(g)
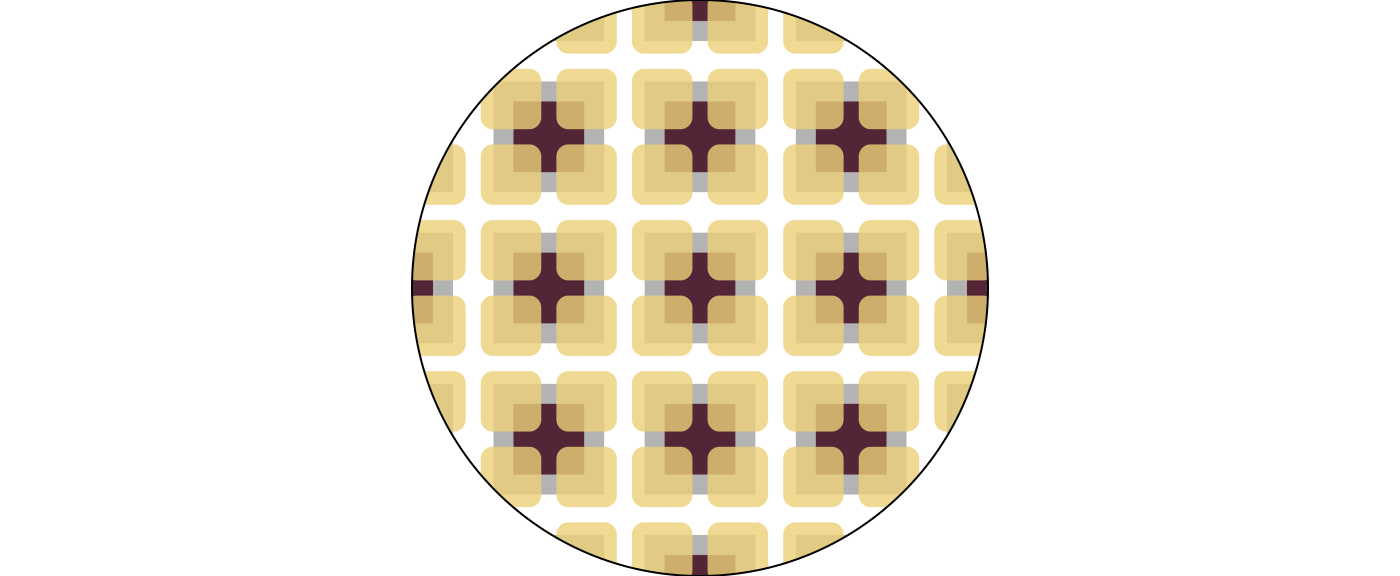
Use pattern as fill for another object
canvas <- circleGrob(r = unit(0.5, 'npc'), gp = gpar(fill = pat))
grid.newpage(); grid.draw(canvas)