Creating fractals with ggplot2 and patchwork
Today in my ongoing quest to generate fractals in Rstats using every available avenue: creating a Sierpinski Triangle and Sierpinski Carpet using patchwork to layout reptitions of 2 simple plots.
Methods for generating fractals so far:
- Sierpinski Triangle in plotmath
- Another sierpinski triangle in plotmath
- Sierpinski triangle using character strings
- Using R matrices to create a sierpinski carpet
- Generating hilbert curves with an ad-hoc L-system
- Barnsley ferns generated by iterated affine transformations
- Ikeda map
- Today: Use
patchworkto iteratively composite two basic plots into Sierpinski Triangle and Sierpinski Carpet
Background
patchwork is a great library written by Thomas Lin Pedersen for compositing multiple plots.
Atusy on twitter posted a golden spiral created from multiple plots using patchwork
and posted his code on github.
This inspired me to continue my series on creating fractals out of constructs in R.
Setup
Create the plots to use as the building blocks of the fractals
- A blank plot
- A plot with a single rectangle
#~~~~~~~~~~~~~~~~~~~~~~~~~~~~~~~~~~~~~~~~~~~~~~~~~~~~~~~~~~~~~~~~~~~~~~~~~~~~~
# Define a blank plot
#~~~~~~~~~~~~~~~~~~~~~~~~~~~~~~~~~~~~~~~~~~~~~~~~~~~~~~~~~~~~~~~~~~~~~~~~~~~~~
b <- ggplot() +
  annotate('rect', xmin=0, ymin=0, xmax=1, ymax=1, fill=NA) +
  theme_void()


#~~~~~~~~~~~~~~~~~~~~~~~~~~~~~~~~~~~~~~~~~~~~~~~~~~~~~~~~~~~~~~~~~~~~~~~~~~~~~
# Define a plot with just a rectangle
#~~~~~~~~~~~~~~~~~~~~~~~~~~~~~~~~~~~~~~~~~~~~~~~~~~~~~~~~~~~~~~~~~~~~~~~~~~~~~
p <- ggplot() +
  annotate('rect', xmin=0, ymin=0, xmax=1, ymax=1) +
  theme_void()

p
Sierpinski Triangle
#~~~~~~~~~~~~~~~~~~~~~~~~~~~~~~~~~~~~~~~~~~~~~~~~~~~~~~~~~~~~~~~~~~~~~~~~~~~~~
# Function to stack + pack a single plot onto itself
#~~~~~~~~~~~~~~~~~~~~~~~~~~~~~~~~~~~~~~~~~~~~~~~~~~~~~~~~~~~~~~~~~~~~~~~~~~~~~
f <- function(p) {
  wrap_plots(
    wrap_plots(b, p, b, widths = c(0.5, 1, 0.5)),
    wrap_plots(p, p),
    ncol = 1L
  )
}
f(p)
f(f(p))
# Rendered offline. Takes about 15 minutes to render/save the plot object
f(f(f(f(f(f(f((p))))))))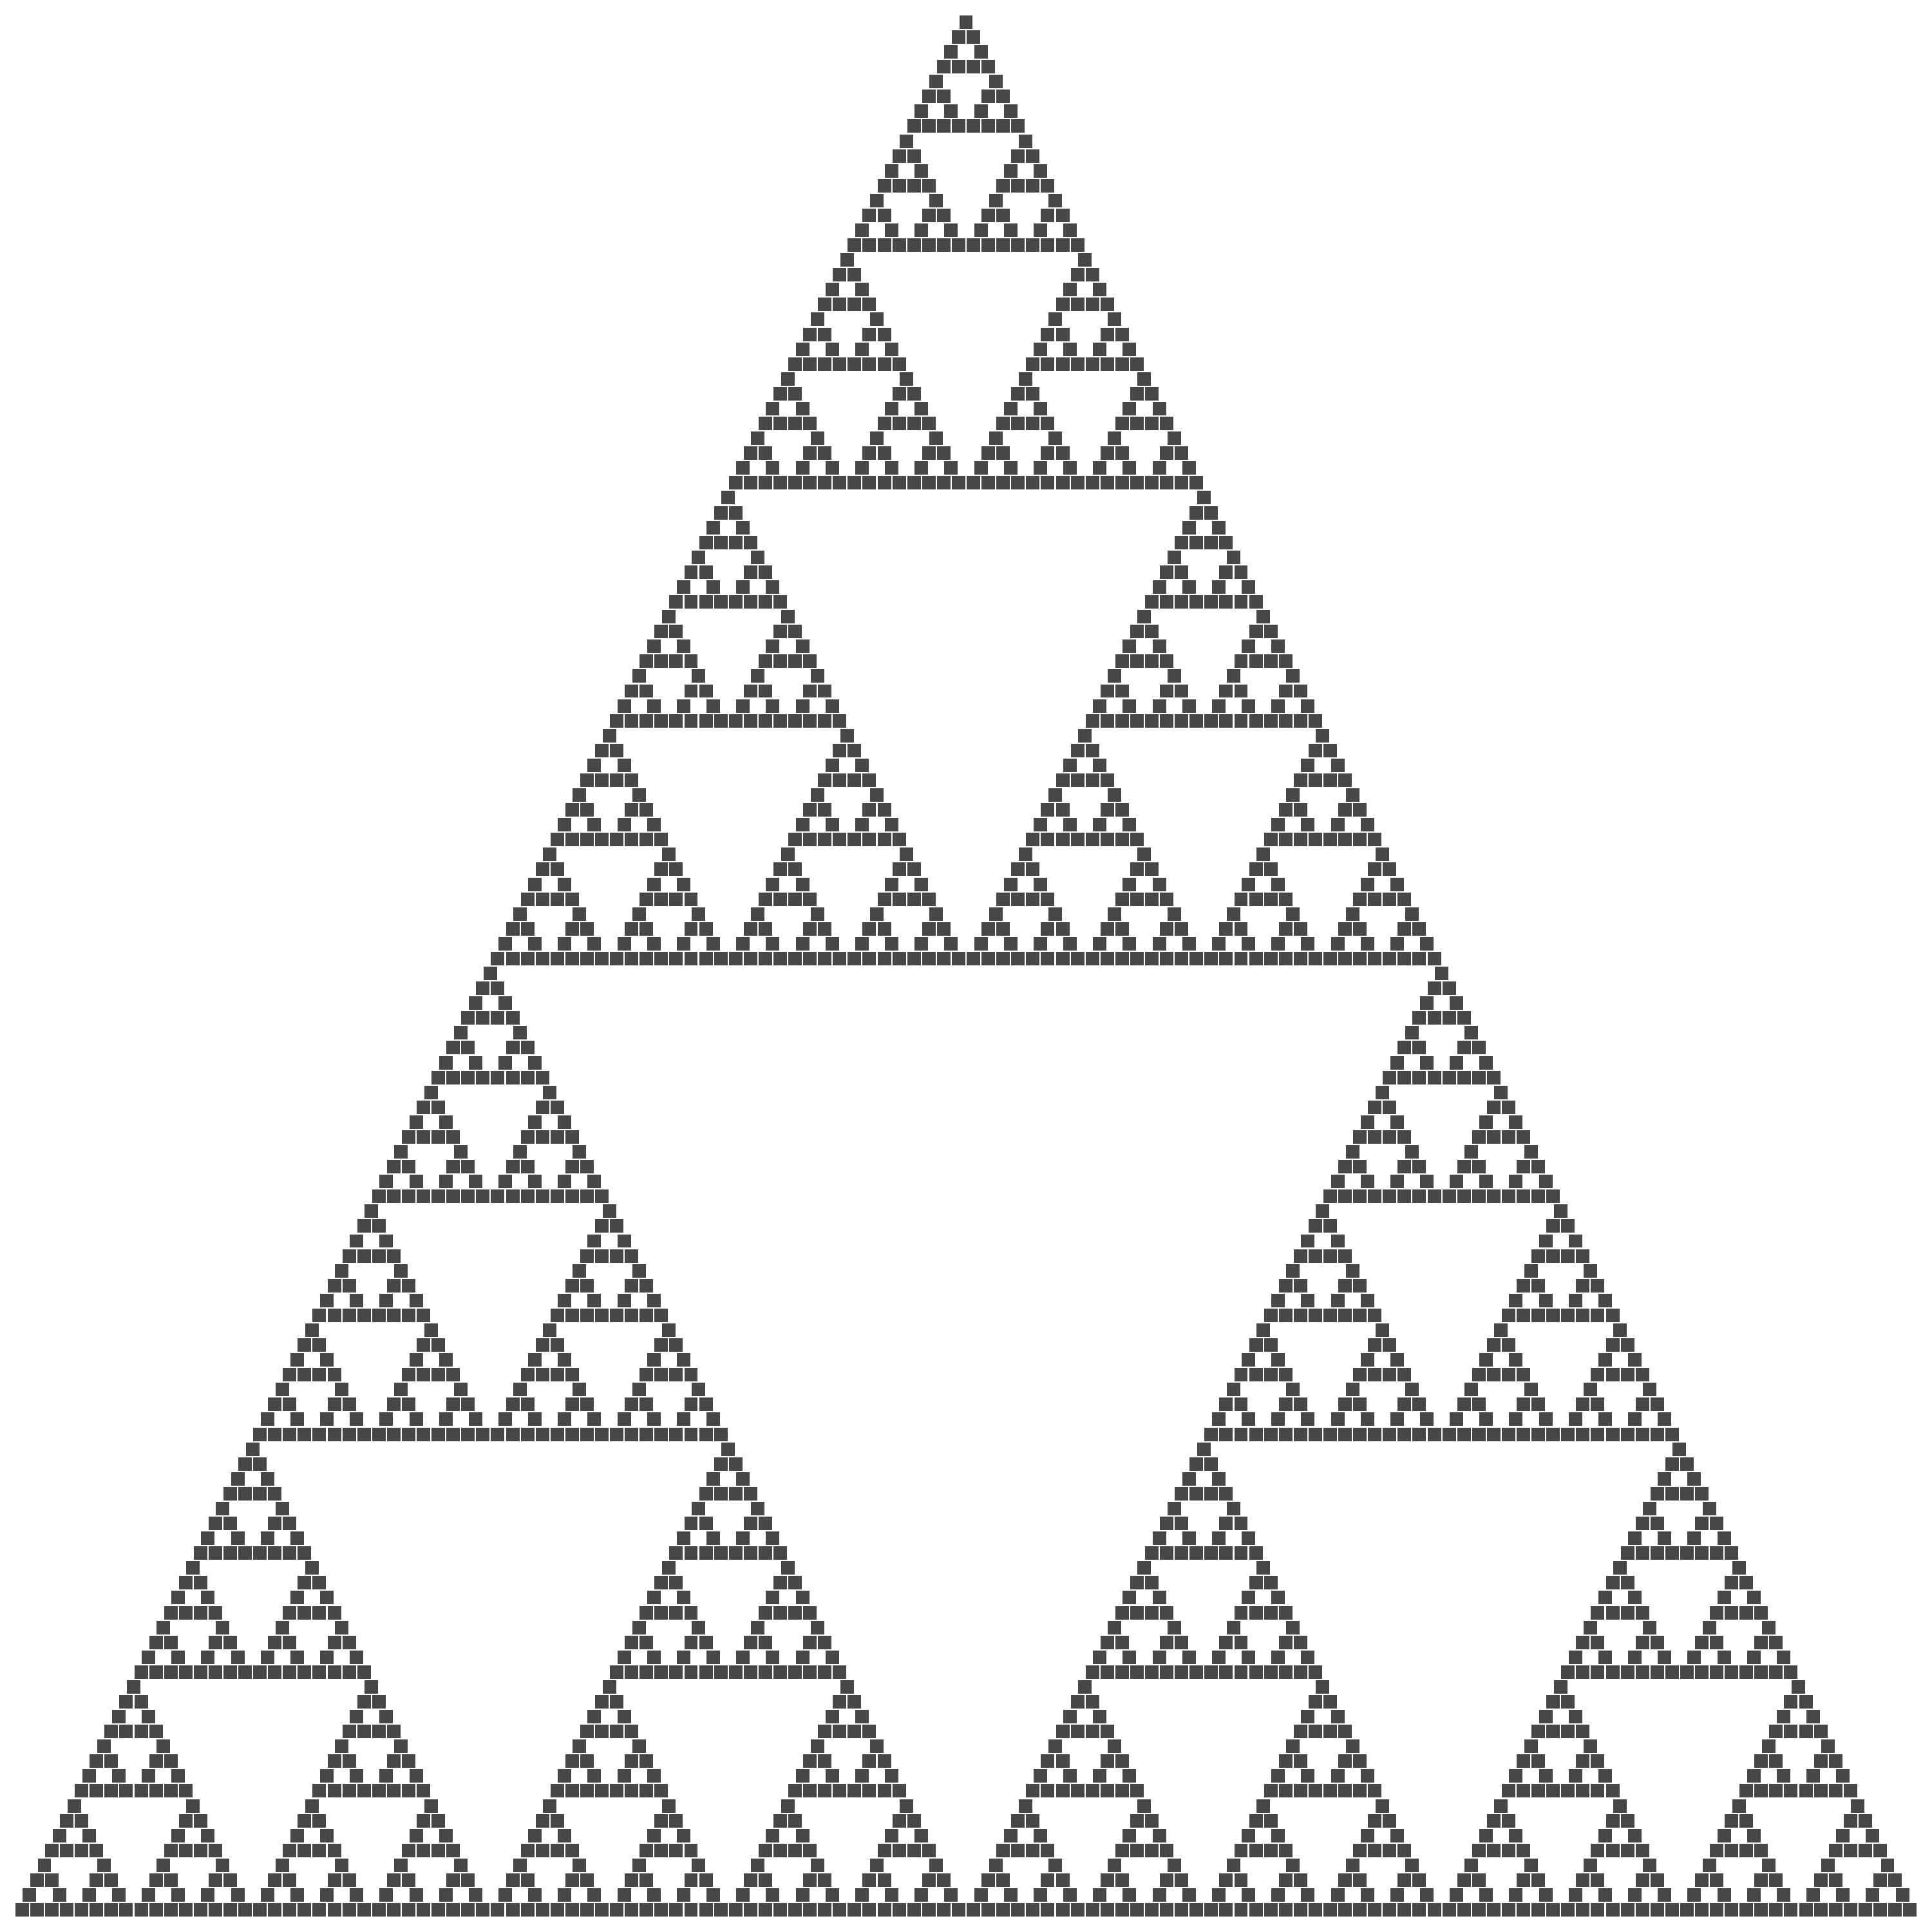
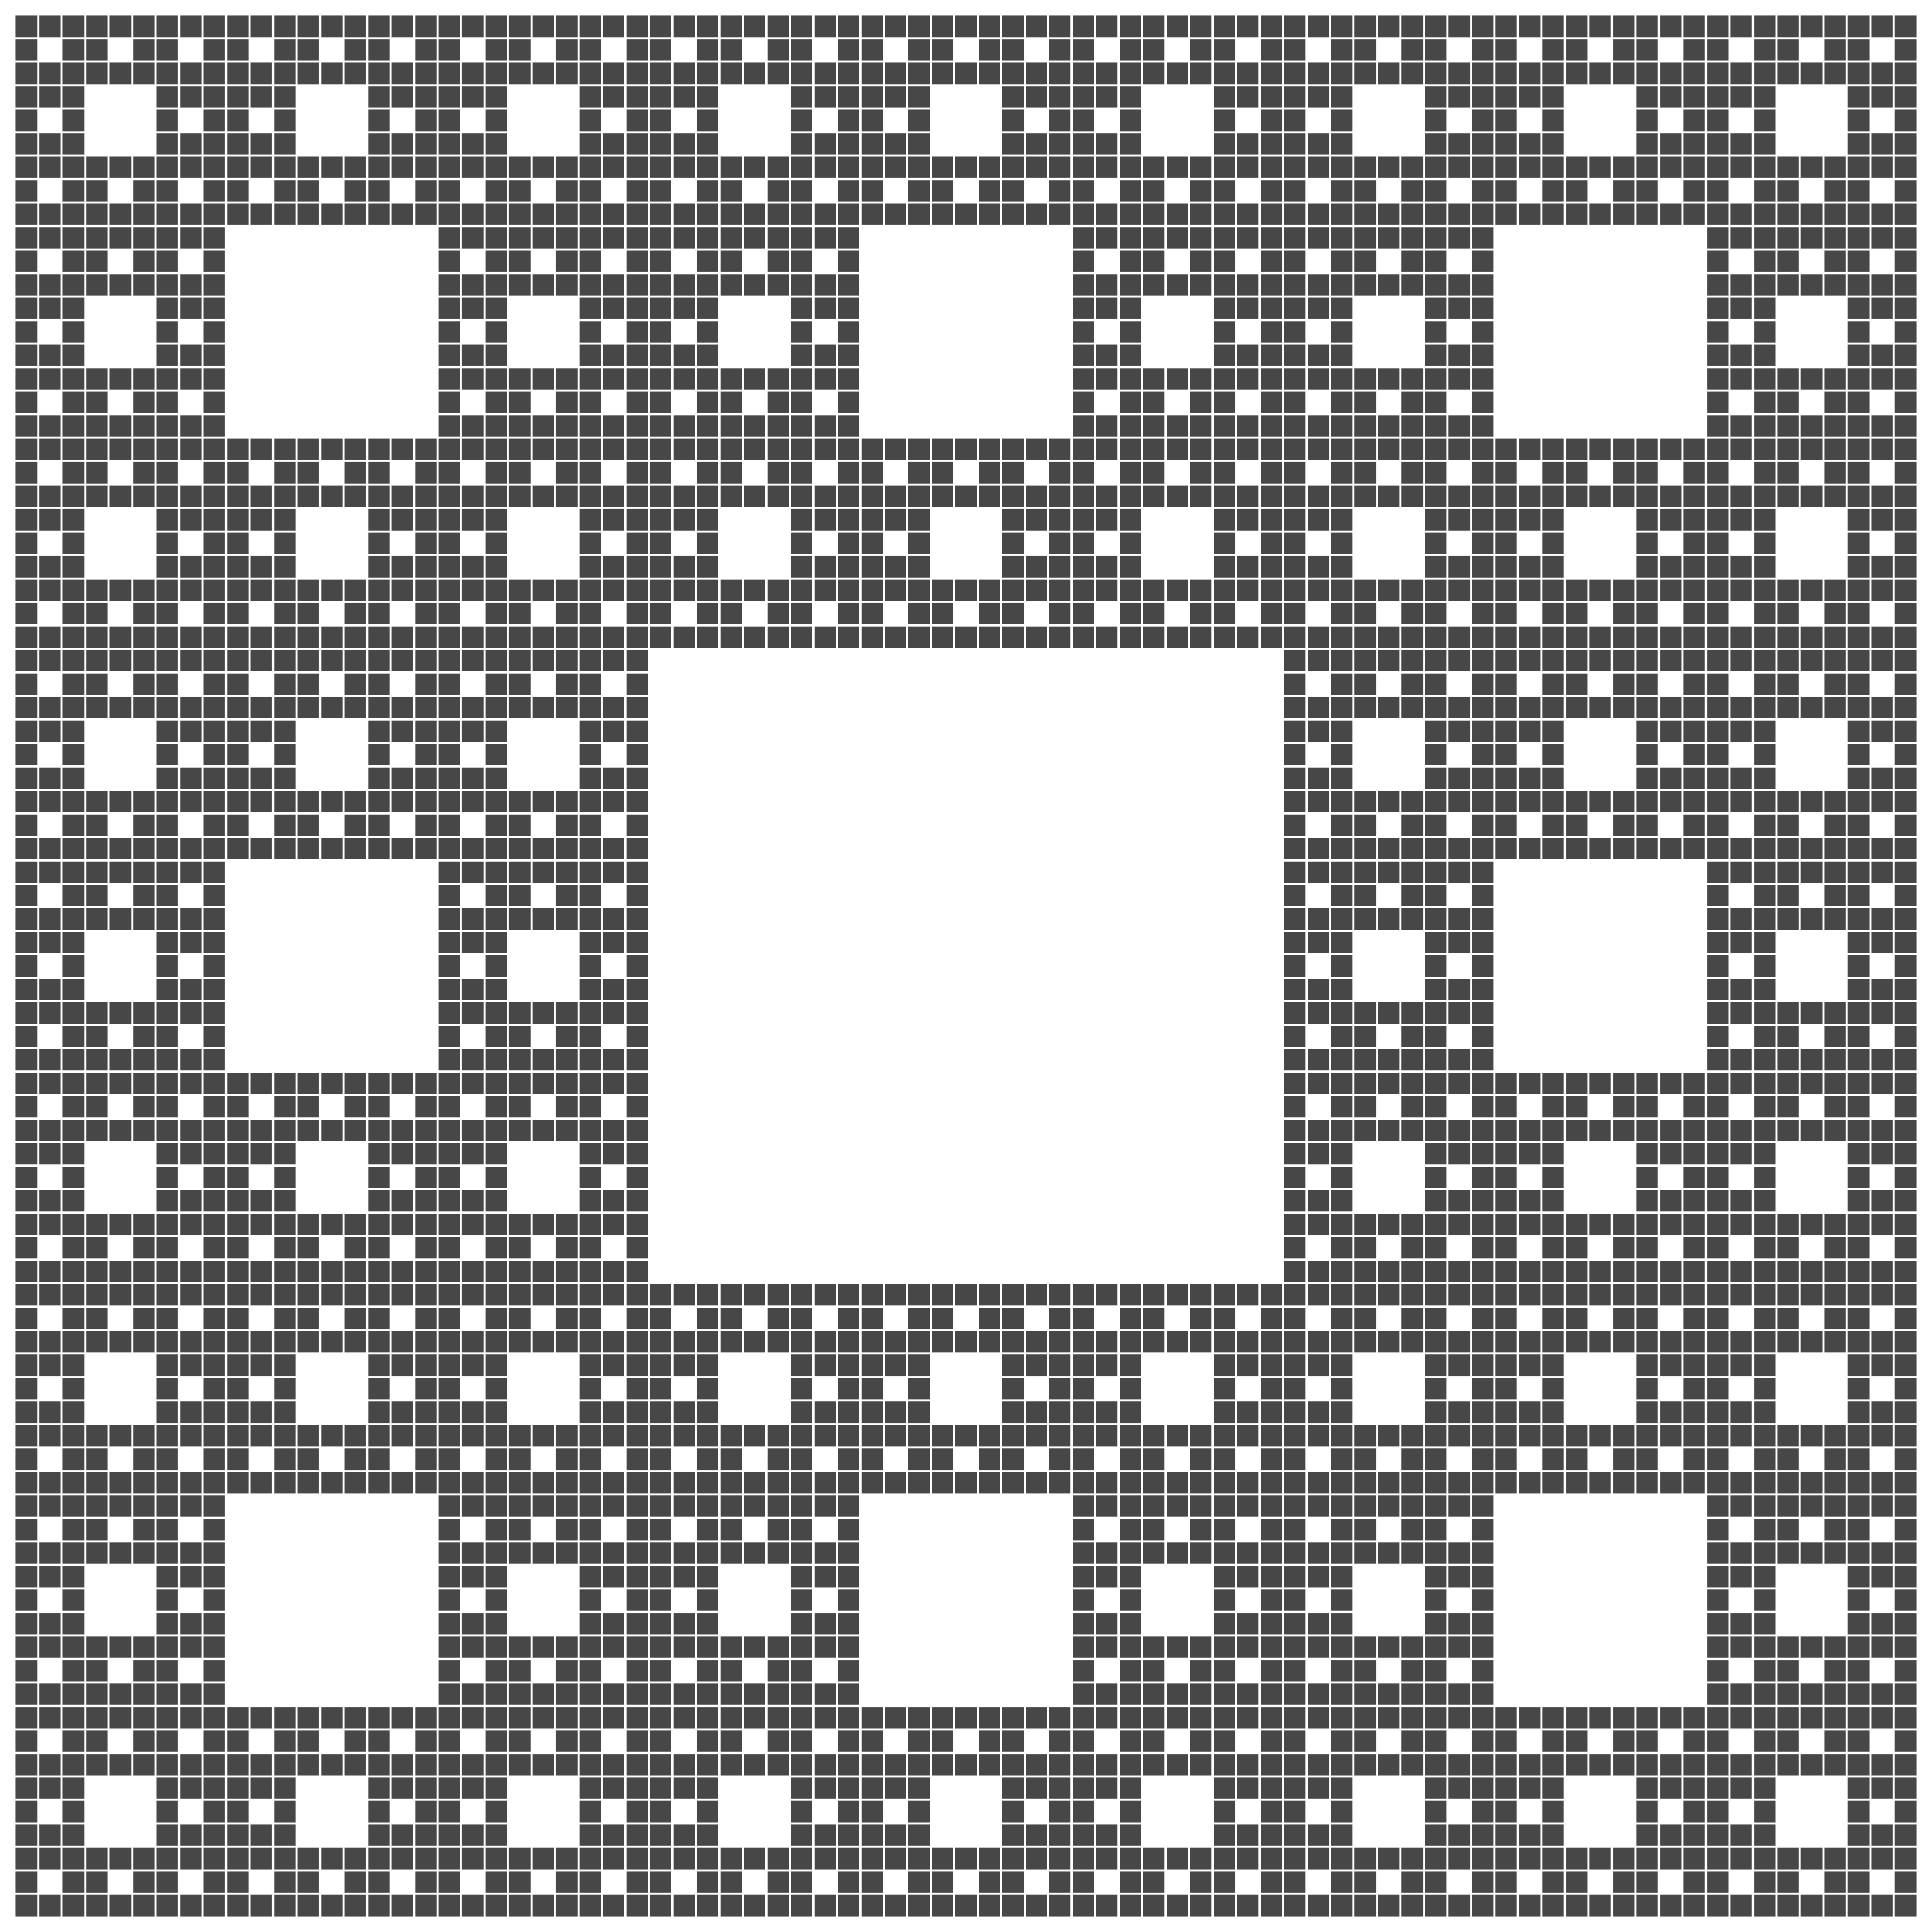
Sierpinski Carpet
#~~~~~~~~~~~~~~~~~~~~~~~~~~~~~~~~~~~~~~~~~~~~~~~~~~~~~~~~~~~~~~~~~~~~~~~~~~~~~
# Create a 3x3 grid repetition of the given plot, but leave a blank plot in the middle
#~~~~~~~~~~~~~~~~~~~~~~~~~~~~~~~~~~~~~~~~~~~~~~~~~~~~~~~~~~~~~~~~~~~~~~~~~~~~~
f <- function(p) wrap_plots(p, p, p, p, b, p, p, p, p, ncol = 3L)
f(p)
f(f(p))
# Rendered offline. Takes about 20 minutes to render/save the plot object
f(f(f(f(p))))