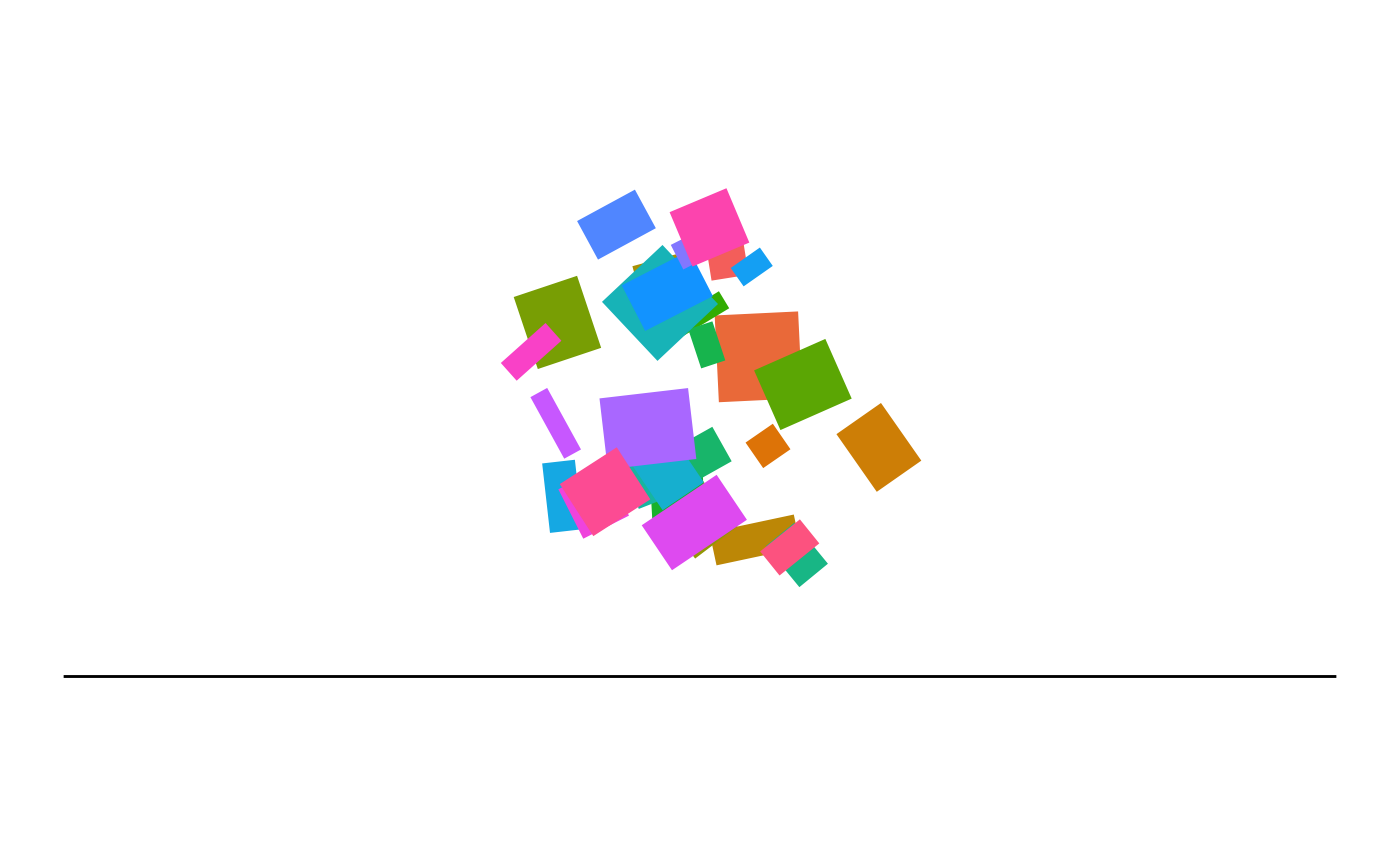
Boxes example
library(chipmunkcore)
library(ggplot2)
set.seed(1)

#~~~~~~~~~~~~~~~~~~~~~~~~~~~~~~~~~~~~~~~~~~~~~~~~~~~~~~~~~~~~~~~~~~~~~~~~~~~~~
# Initialize a simulation space
#~~~~~~~~~~~~~~~~~~~~~~~~~~~~~~~~~~~~~~~~~~~~~~~~~~~~~~~~~~~~~~~~~~~~~~~~~~~~~
cm <- Chipmunk$new()

#~~~~~~~~~~~~~~~~~~~~~~~~~~~~~~~~~~~~~~~~~~~~~~~~~~~~~~~~~~~~~~~~~~~~~~~~~~~~~
# Add fixed segments
#~~~~~~~~~~~~~~~~~~~~~~~~~~~~~~~~~~~~~~~~~~~~~~~~~~~~~~~~~~~~~~~~~~~~~~~~~~~~~
cm$add_static_segment(-70, 0, 70, 0)

#~~~~~~~~~~~~~~~~~~~~~~~~~~~~~~~~~~~~~~~~~~~~~~~~~~~~~~~~~~~~~~~~~~~~~~~~~~~~~
# Fetch all the segments. Use for plotting
#~~~~~~~~~~~~~~~~~~~~~~~~~~~~~~~~~~~~~~~~~~~~~~~~~~~~~~~~~~~~~~~~~~~~~~~~~~~~~
segments_df <- cm$get_static_segments()

#~~~~~~~~~~~~~~~~~~~~~~~~~~~~~~~~~~~~~~~~~~~~~~~~~~~~~~~~~~~~~~~~~~~~~~~~~~~~~
# Add some boxes
#~~~~~~~~~~~~~~~~~~~~~~~~~~~~~~~~~~~~~~~~~~~~~~~~~~~~~~~~~~~~~~~~~~~~~~~~~~~~~
for (i in 1:30) {
  cm$add_box(
    x      = runif(1, -20, 20),
    y      = runif(1,  10, 50),
    width  = runif(1, 2, 10),
    height = runif(1, 2, 10),
    angle  = runif(1, 0, 45)
  )
}

#~~~~~~~~~~~~~~~~~~~~~~~~~~~~~~~~~~~~~~~~~~~~~~~~~~~~~~~~~~~~~~~~~~~~~~~~~~~~~
# The raw box form is width height and angle of rotation.  However
# this isn't very handy for plotting with ggplot
#~~~~~~~~~~~~~~~~~~~~~~~~~~~~~~~~~~~~~~~~~~~~~~~~~~~~~~~~~~~~~~~~~~~~~~~~~~~~~
boxes <- cm$get_boxes()
head(boxes, 10)
#> idx x y angle width height
#> 1 1 2.9141345 46.32831 0.15840062 4.124069 4.976991
#> 2 2 6.4319117 35.16456 0.04852682 9.187117 9.557402
#> 3 3 7.4809139 25.36415 0.60463204 3.647797 3.412454
#> 4 4 19.6762438 25.20141 0.61060405 5.981594 7.740948
#> 5 5 6.0669506 15.02220 0.20987462 9.477642 3.697140
#> 6 6 -4.7044817 44.78763 0.26730948 5.088913 2.107123
#> 7 7 -0.2583477 17.44870 0.64981748 5.856641 6.796527
#> 8 8 -15.6822550 38.94844 0.32301418 7.347734 8.353919
#> 9 9 11.3173105 32.12145 0.41604079 8.567570 7.176482
#> 10 10 -0.9107974 39.29255 0.54407009 8.314850 2.186650
#~~~~~~~~~~~~~~~~~~~~~~~~~~~~~~~~~~~~~~~~~~~~~~~~~~~~~~~~~~~~~~~~~~~~~~~~~~~~~
# Get the boxes as a list of vertices. This is ideal for
# ggplot::geom_polygon()
#~~~~~~~~~~~~~~~~~~~~~~~~~~~~~~~~~~~~~~~~~~~~~~~~~~~~~~~~~~~~~~~~~~~~~~~~~~~~~
boxes <- cm$get_boxes_as_polygons()
head(boxes, 8)
#>    idx vertex          x        y
#> 1    1      1  1.2704478 43.54571
#> 31   1      2  5.3428872 44.19623
#> 61   1      3  4.5578213 49.11092
#> 91   1      4  0.4853819 48.46039
#> 2    2      1  2.0755647 30.16866
#> 32   2      2 11.2518671 30.61431
#> 62   2      3 10.7882587 40.16046
#> 92   2      4  1.6119563 39.71481
#~~~~~~~~~~~~~~~~~~~~~~~~~~~~~~~~~~~~~~~~~~~~~~~~~~~~~~~~~~~~~~~~~~~~~~~~~~~~~
# Advance the simulation
#~~~~~~~~~~~~~~~~~~~~~~~~~~~~~~~~~~~~~~~~~~~~~~~~~~~~~~~~~~~~~~~~~~~~~~~~~~~~~
cm$advance(40)

#~~~~~~~~~~~~~~~~~~~~~~~~~~~~~~~~~~~~~~~~~~~~~~~~~~~~~~~~~~~~~~~~~~~~~~~~~~~~~
# Plot everything
#~~~~~~~~~~~~~~~~~~~~~~~~~~~~~~~~~~~~~~~~~~~~~~~~~~~~~~~~~~~~~~~~~~~~~~~~~~~~~
ggplot(boxes) +
  geom_polygon(aes(x, y, group = idx, fill = as.factor(idx))) +
  geom_segment(data = segments_df, aes(x = x1, y = y1, xend = x2, yend = y2)) +
  coord_fixed() +
  theme_void() +
  theme(legend.position = 'none')