custom-aesthetics-glue-strings
Source:vignettes/custom-aesthetics-glue-strings.Rmd
custom-aesthetics-glue-strings.RmdIntroduction
Using custom glue strings within SVG allow for
customised control of SVG rendering.
Rendering is not limited to CSS Selector properties. You can insert text dynamically for parameters such as animation parameters, class names or really anything within an SVG.
Test data
test_df <- data.frame(
  x = runif(10),
  y = runif(10),
  count = sample(3:5, 10, T),
  type  = sample(c('a', 'b', 'c'), 10, T))

test_df
#>              x          y count type
#> 1  0.009780187 0.24213958     5    c
#> 2  0.418637233 0.07107137     4    a
#> 3  0.859931345 0.60860420     4    c
#> 4  0.313054785 0.96294802     5    b
#> 5  0.340939646 0.57566860     4    b
#> 6  0.194373528 0.07492284     3    a
#> 7  0.757206239 0.07059356     5    b
#> 8  0.243068227 0.43113919     3    b
#> 9  0.890072579 0.36593730     5    b
#> 10 0.013925112 0.37696188     5    c
Mapping Aesthetics with {glue} strings
Here is a simple SVG consisting of 2 stacked circles - a big circle on the bottom and a small circle resting on top.
snowman_txt <- '
  <svg viewBox="0 0 100 100 ">
    <circle id="top" cx="50" cy="20" r="20" fill="brown" stroke="black" />
    <circle id="bot" cx="50" cy="70" r="30" fill="brown" stroke="black" />
  </svg>
  '

grid::grid.draw( svg_to_rasterGrob(snowman_txt, width=800, height=800) )
In this example, I want to be able to map values to the fill colour for the top and bottom circles.
To do this I insert formatting strings as used in the
glue package i.e. insert new mapped variables
{{bot_fill}} and {{top_fill}}.
When creating the plot, ggsvg will fill in these
locations with appropriately mapped variables dependend on what
scale_svg*() are applied to tplot
snowman_txt <- '
  <svg viewBox="0 0 100 100 ">
    <circle id="top"  cx="50" cy="20" r="20" fill="{{top_fill}}" stroke="black" />
    <circle id="bot"  cx="50" cy="70" r="30" fill="{{bot_fill}}" stroke="black" />
  </svg>
  '

ggplot(test_df) +
  geom_point_svg(aes(x, y, top_fill = count),
                 svg = snowman_txt, size = 20,
                 bot_fill='#aaaaaa') +
  theme_bw() +
scale_svg_default() 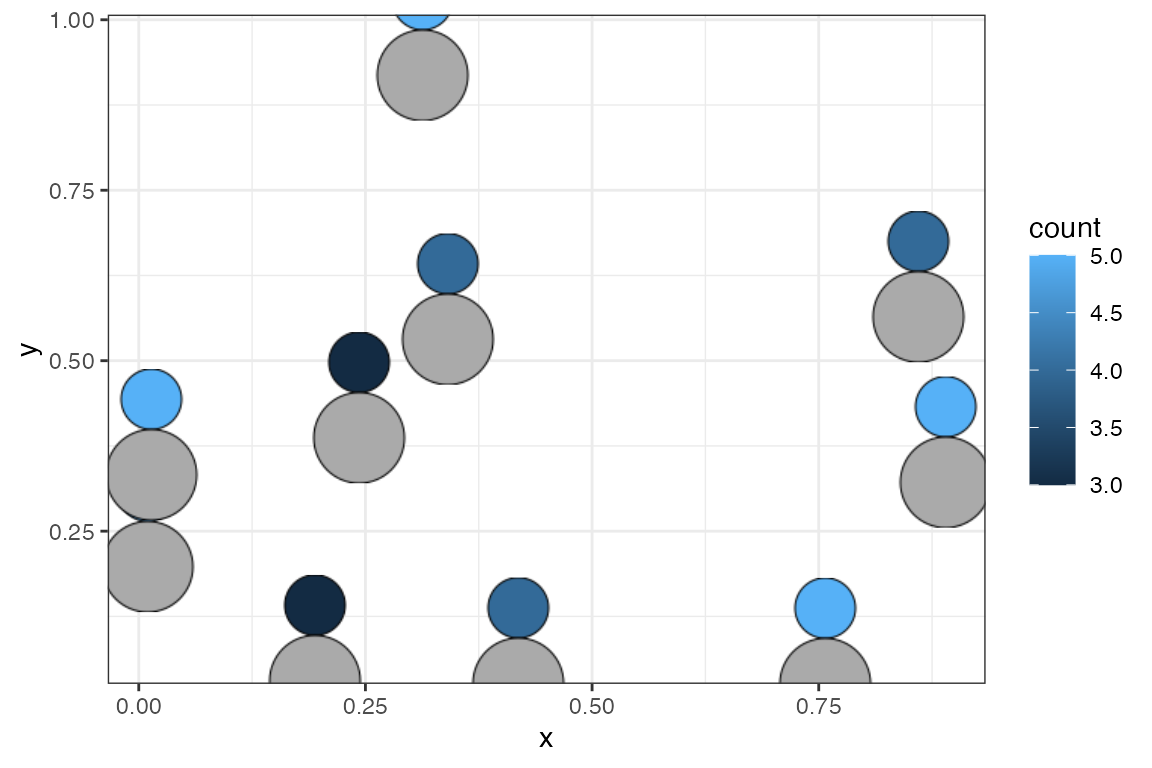
ggplot(test_df) +
  geom_point_svg(aes(x, y, top_fill = count),
                 svg = snowman_txt, size = 20,
                 bot_fill='#aaaaaa') +
  theme_bw() +
  scale_svg_fill_viridis_c(aesthetics = "top_fill")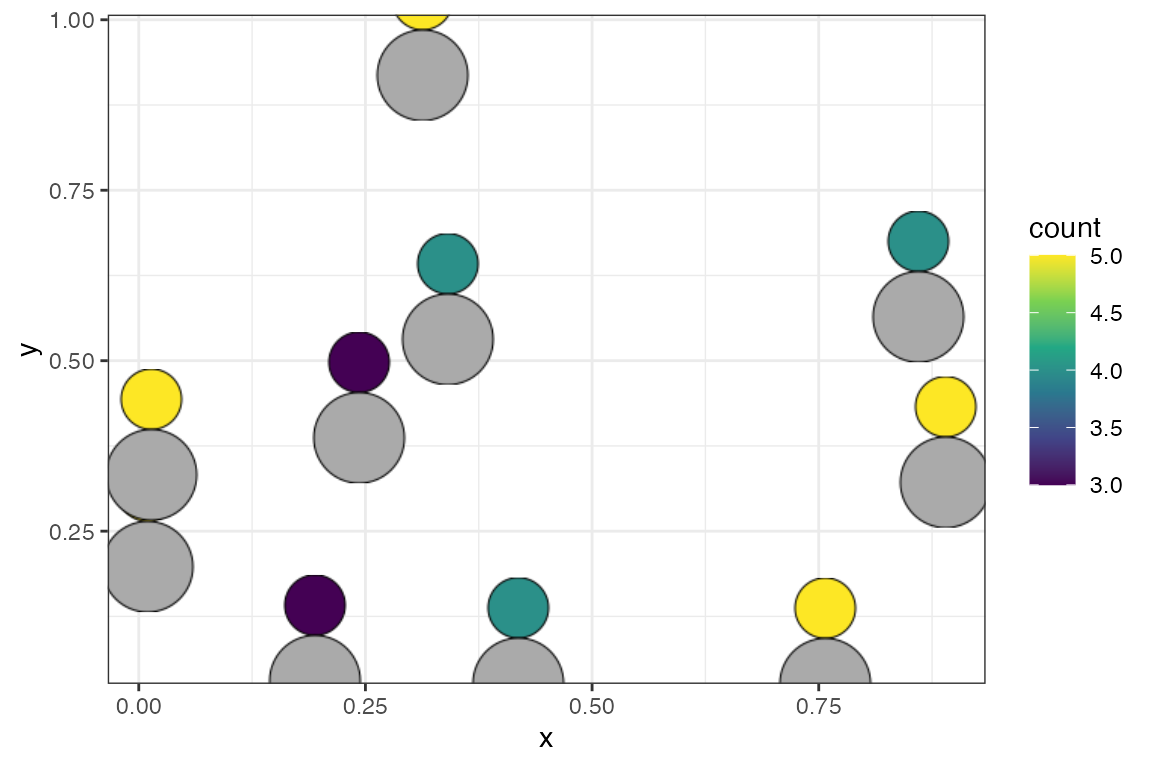
ggplot(test_df) +
  geom_point_svg(aes(x, y,
                     top_fill = count, bot_fill = x),
                 svg = snowman_txt, size = 20) +
  theme_bw() +
  scale_svg_fill_viridis_c(aesthetics = "top_fill") +
  scale_svg_fill_viridis_c(aesthetics = "bot_fill", option = 'A')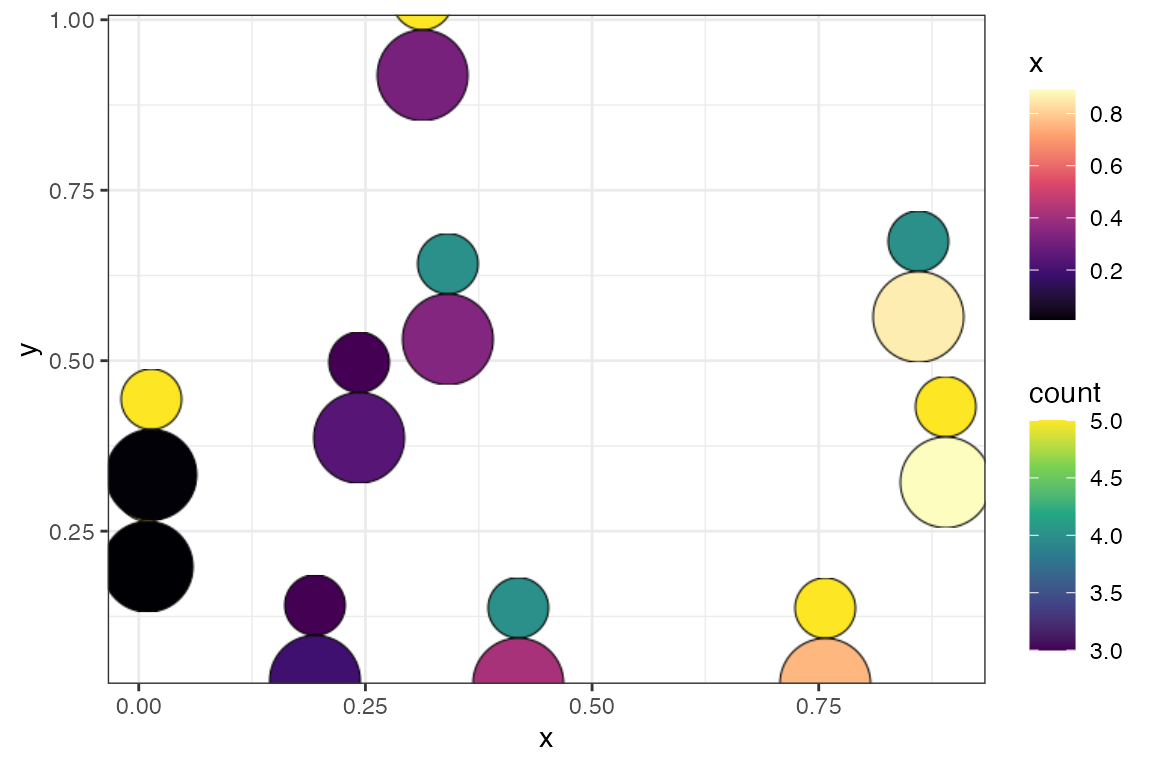
Preferred naming for custom aesthetics
Custom aesthetics should be named with a _[type] suffix
in order to keep ggsvg working well with
ggplot2. E.g:
- Use
shade_fill. Notshadeorfill_shade - Use
rect_size. Notsize_rectorrect_bigness - Use
path_alpha. Nottransparency
The type suffix should be any of the standard ggplot
aesthetics (fill, colour, size etc).
The prefix can be any name that makes sense to you.
Naming in this way will allow multiple fill aesthetics as long as they have a unique name.