Non-Standard Aesthetic: Rotation
Source:vignettes/non-standard-aesthetic-rotation.Rmd
non-standard-aesthetic-rotation.RmdIntroduction
This example steps through the process of creating an SVG and mapping an SVG characteristic into a ggplot2 aesthetic.
ggplot2 aesthethics are not limited to colour, fill, size etc.
Anything in SVG can be used as a target for an aesthetic mapping.
In this example the rotation of an SVG arrow is controlled via a value in a data.frame.
Overview:
- Introduce parameters with glue syntax, using
double curly braces
{{}} - Set the defaults for these parameters using
geom_point_svg(..., defaults = list(...)) - Use these parameters as aesthetics
- Add an appropriate
scale_svg_*()to inform ggplot2 how to map values to this parameter (which it will then insert into the SVG text)
Define the base SVG
#~~~~~~~~~~~~~~~~~~~~~~~~~~~~~~~~~~~~~~~~~~~~~~~~~~~~~~~~~~~~~~~~~~~~~~~~~~
# Generic SVG arrow
#~~~~~~~~~~~~~~~~~~~~~~~~~~~~~~~~~~~~~~~~~~~~~~~~~~~~~~~~~~~~~~~~~~~~~~~~~~
arrow_text <- '
<svg viewBox="0 0 100 100">
  <g transform="rotate(45 50 50)">
    <line x1="10" y1="50" x2="90" y2="50" stroke="black" stroke-width="2" />
    <line x1="70" y1="30" x2="90" y2="50" stroke="black" stroke-width="2" />
    <line x1="70" y1="70" x2="90" y2="50" stroke="black" stroke-width="2" />
  </g>
</svg>
'

grid::grid.draw( svg_to_rasterGrob(arrow_text) )
Create parameterised SVG
In order to create a responsive SVG that has values dynamically
mapped in ggplot2, add named parameters in place of values
in the SVG text.
In this example the SVG transform to rotate the arrow is
rotate(45 50 50) and this has been parameterised to
rotate({{angle}} 50 50 ).
#~~~~~~~~~~~~~~~~~~~~~~~~~~~~~~~~~~~~~~~~~~~~~~~~~~~~~~~~~~~~~~~~~~~~~~~~~~
# SVG arrow with controllable rotation angle
#~~~~~~~~~~~~~~~~~~~~~~~~~~~~~~~~~~~~~~~~~~~~~~~~~~~~~~~~~~~~~~~~~~~~~~~~~~
arrow_text <- '
<svg viewBox="0 0 100 100">
  <g transform="rotate({{arrow_angle}} 50 50)">
    <line x1="10" y1="50" x2="90" y2="50" stroke="black" stroke-width="2" />
    <line x1="70" y1="30" x2="90" y2="50" stroke="black" stroke-width="2" />
    <line x1="70" y1="70" x2="90" y2="50" stroke="black" stroke-width="2" />
  </g>
</svg>
'

#~~~~~~~~~~~~~~~~~~~~~~~~~~~~~~~~~~~~~~~~~~~~~~~~~~~~~~~~~~~~~~~~~~~~~~~~~~
# Test the rotation is changed as 'angle' is changed
#~~~~~~~~~~~~~~~~~~~~~~~~~~~~~~~~~~~~~~~~~~~~~~~~~~~~~~~~~~~~~~~~~~~~~~~~~~
arrow_angle <- -30
final_svg <- glue::glue(arrow_text, .open = "{{", .close = "}}")

grid::grid.draw( svg_to_rasterGrob(final_svg) )
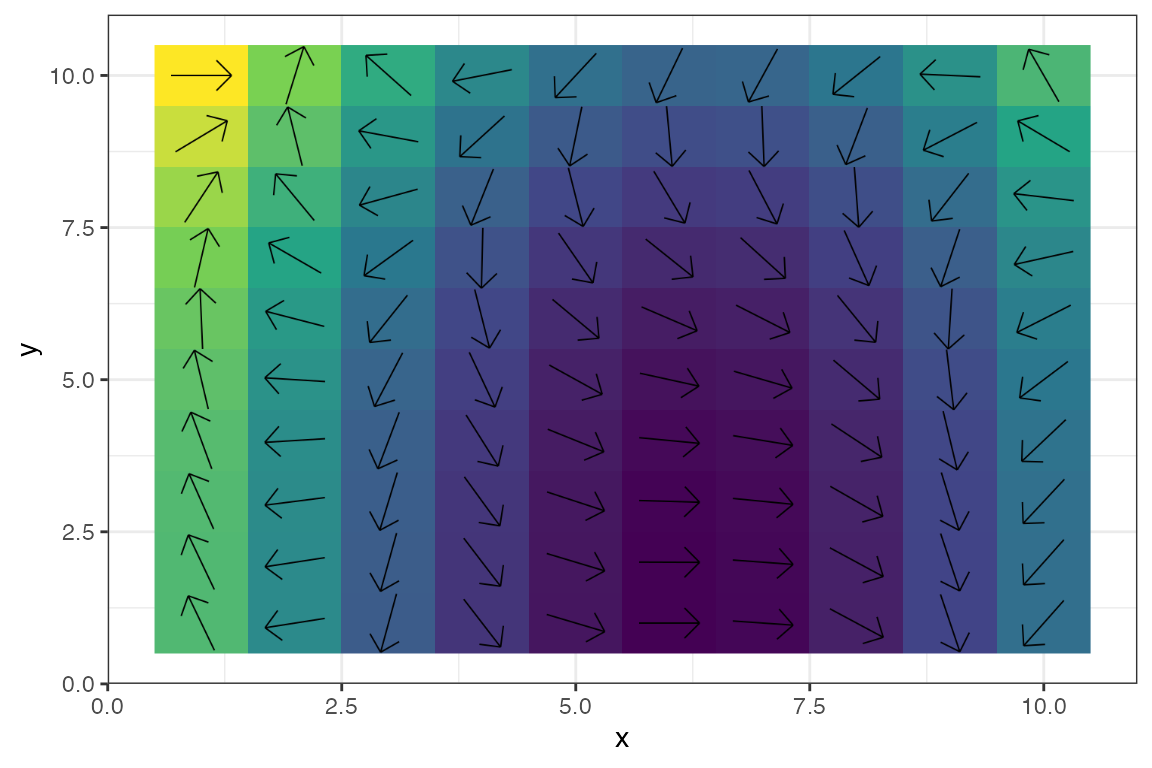
Create a plot with rotating SVG arrow
#~~~~~~~~~~~~~~~~~~~~~~~~~~~~~~~~~~~~~~~~~~~~~~~~~~~~~~~~~~~~~~~~~~~~~~~~~~
# Create a plausible vector field
#~~~~~~~~~~~~~~~~~~~~~~~~~~~~~~~~~~~~~~~~~~~~~~~~~~~~~~~~~~~~~~~~~~~~~~~~~~
set.seed(13)
value <- 360 * as.vector(ambient::normalise(ambient::noise_perlin(c(10, 10))))
data  <- cbind(expand.grid(x=1:10, y=1:10), value)

#~~~~~~~~~~~~~~~~~~~~~~~~~~~~~~~~~~~~~~~~~~~~~~~~~~~~~~~~~~~~~~~~~~~~~~~~~~
# Use 'value' to control the arrow angle
#~~~~~~~~~~~~~~~~~~~~~~~~~~~~~~~~~~~~~~~~~~~~~~~~~~~~~~~~~~~~~~~~~~~~~~~~~~
ggplot(data) +
  geom_raster(aes(x, y, fill = value)) +
  geom_point_svg(
    aes(x, y, arrow_angle = I(value)),
    svg = arrow_text,
    size = 10#,
    # defaults = list(arrow_angle = 0)
  ) +
  theme_bw() +
  theme(legend.position = 'none') +
  scale_fill_viridis_c()