Single SVG with multiple aesthetics - Mushroom plot
Source:vignettes/mushroom-plot.Rmd
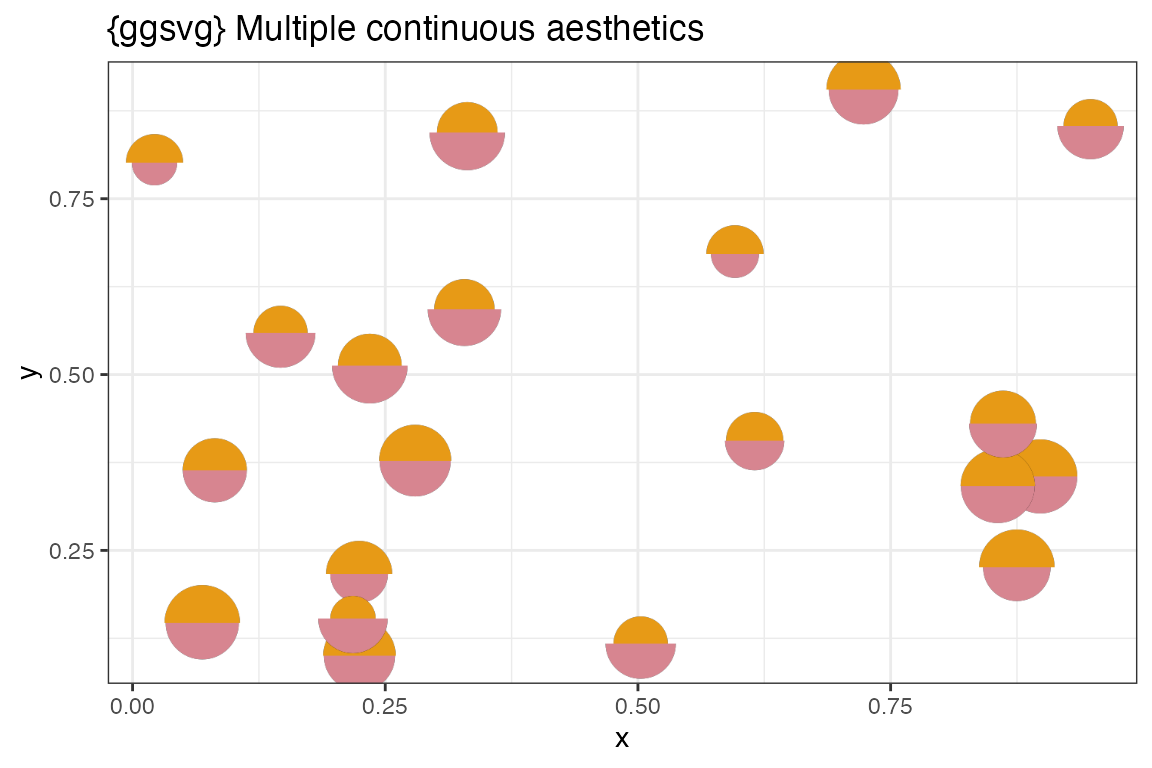
mushroom-plot.RmdMushroom plot
A mushroom plot is a style of plot consistning of two semi-circles which can be sized/styled independently to represent two quantities at a single graph location.
Create the base SVG
Note: Semicircles are drawn with path arcs in SVG and aren’t that intuitive.
#~~~~~~~~~~~~~~~~~~~~~~~~~~~~~~~~~~~~~~~~~~~~~~~~~~~~~~~~~~~~~~~~~~~~~~~~~~
# Hand craft two semi-circles using SVG path arcs
#~~~~~~~~~~~~~~~~~~~~~~~~~~~~~~~~~~~~~~~~~~~~~~~~~~~~~~~~~~~~~~~~~~~~~~~~~~
semicircles_svg <- '
<svg width="100" height="100">
  <path d="M 0,50 a50,50 0 1,1 100,0" fill="#E79A16" />
  <path d="M 0,50 a50,50 0 0,0 100,0" fill="#D78590" />
</svg>
'

grid::grid.draw( svg_to_rasterGrob(semicircles_svg) )
Create Parameterised SVG
Add {{}} glue string locations and test it out
#~~~~~~~~~~~~~~~~~~~~~~~~~~~~~~~~~~~~~~~~~~~~~~~~~~~~~~~~~~~~~~~~~~~~~~~~~~
# Parameterise the radii for use with glue
#~~~~~~~~~~~~~~~~~~~~~~~~~~~~~~~~~~~~~~~~~~~~~~~~~~~~~~~~~~~~~~~~~~~~~~~~~~
semicircles_svg <- '
<svg width="100" height="100">
  <path d="M {{50-top_radius}},50 a{{top_radius}},{{top_radius}} 0 1,1 {{2*top_radius}},0" fill="#E79A16" />
  <path d="M {{50-bot_radius}},50 a{{bot_radius}},{{bot_radius}} 0 0,0 {{2*bot_radius}},0" fill="#D78590" />
</svg>
'

top_radius <- 40
bot_radius <- 30

final_svg <- glue::glue(semicircles_svg, .open = "{{", .close = "}}")

grid::grid.draw( svg_to_rasterGrob(final_svg))
Create a ggsvg plot mapping 2 different quantities to
the size
N <- 20
data <- data.frame(
  x  = runif(N),
  y  = runif(N),
  q1 = runif(N),
  q2 = runif(N),
  stringsAsFactors = FALSE
)

ggplot(data) +
  geom_point_svg(
    aes(x, y, top_radius = q1, bot_radius = q2),
    svg = semicircles_svg,
    defaults = list(top_radius = 50, bot_radius = 50),
    size = 10
  ) +
  scale_svg_size('top_radius', range = c(30, 50), guide = 'none') +
  scale_svg_size('bot_radius', range = c(30, 50), guide = 'none') +
  theme_bw() +
  labs(
    title = "{ggsvg} Multiple continuous aesthetics"
  )