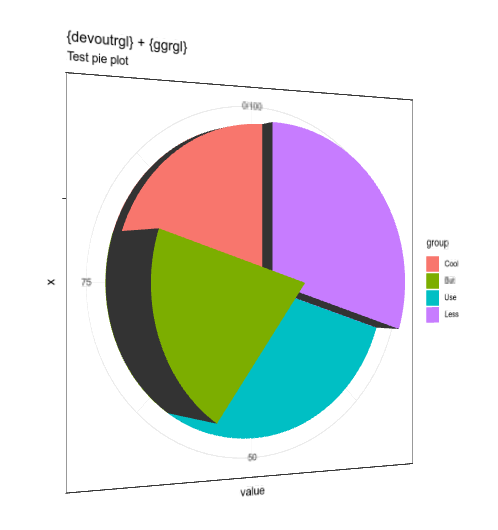
ggrgl extends ggplot2 into the third dimension.
ggrgl does this by adding a new z aesthetic which is respected when a plot is rendered to the {devoutrgl} device which renders to OpenGL via {rgl}.
Because devoutrgl is an interactive device, the view of the plot may be manipulated by the user - zoom, rotate, change field-of-view etc.
Slideshow
Note: interactive 3d plots cannot be displayed in a github README file, and static images or animated gifs are used here instead.
Visit the pkgdown online documentation to view plots which can be manipulated in the browser.
Installation
A lot of support packages are needed for ggrgl - most of which should already be installed if you have ggplot.
Custom packages which are needed (and not currently on CRAN):
- devout - The core package for writing graphics devices using R (rather than C).
- devoutrgl - a graphics device which renders to rgl
-
triangular - decompaose polygons into triangles for 3d rendering. Much faster than
rgl::triangulate() - snowcrash - a package for encoding objects as images - needed to circumvent limitations in the device system provided by R
- cryogenic - a package for capturing a call to be evaluated later. Calls to generate 3d geometry are generated when plot object is created, but not executed until later when the plot is actually rendered to screen.
You can install from GitHub with:
# install.package('remotes')
remotes::install_github('coolbutuseless/devout')
remotes::install_github('coolbutuseless/devoutrgl')
remotes::install_github('coolbutuseless/triangular')
remotes::install_github('coolbutuseless/snowcrash')
remotes::install_github('coolbutuseless/cryogenic')
remotes::install_github('coolbutuseless/ggrgl', ref='main')
New z Aesthetic
The new z aesthetic works the same as the x and y aesthetics in ggplot2.
z may be mapped to a data variable or set to a constant.
New Extrusion Aesthetics
When graphical elements have a z value they are raised above the ground.
By setting extrude = TRUE (on geoms which support it), then the raised element is connected to the ground as if it were extruded from it.
New aesthetics control the appearance of the extruded faces and edges:
| aesthetic | Description | default |
|---|---|---|
| extrude_z | Lower limit of extrusion | 0.05 |
| extrude_face_fill | Extruded face colour | grey20 |
| extrude_face_alpha | Extruded face alpha | 1 |
| extrude_edge_colour | Edge colour for extrusion | NA |
| extrude_edge_alpha | Edge alpha for extrusion | 1 |
| extrude_edge_size | Width of line for extruded edges | 1 |
3-dimensional Geometry Types: z and 3d
ggrgl defines 2 classes of geoms: z and 3d
-
zgeoms are identical to theirggplot2counterparts, except the entire shape may be raised (as a unit) in the z direction. The resulting geometry will still be planar, and parallel to the original plotting surface. -
3dgeoms allow for full specification of (x, y, z) locations. Their orientation is not constrained to be planar, or parallel to the original plotting surface.
Click on a geom in the following table to view its vignette
| ggplot2 | Planar Z offset | 3d |
|---|---|---|
| geom_bar | geom_bar_z | |
| geom_contour | geom_contour_z | |
| geom_contour_filled | geom_contour_filled_z | |
| geom_density | geom_density_z | |
| geom_line | geom_line_3d | |
| geom_path | geom_path_3d | |
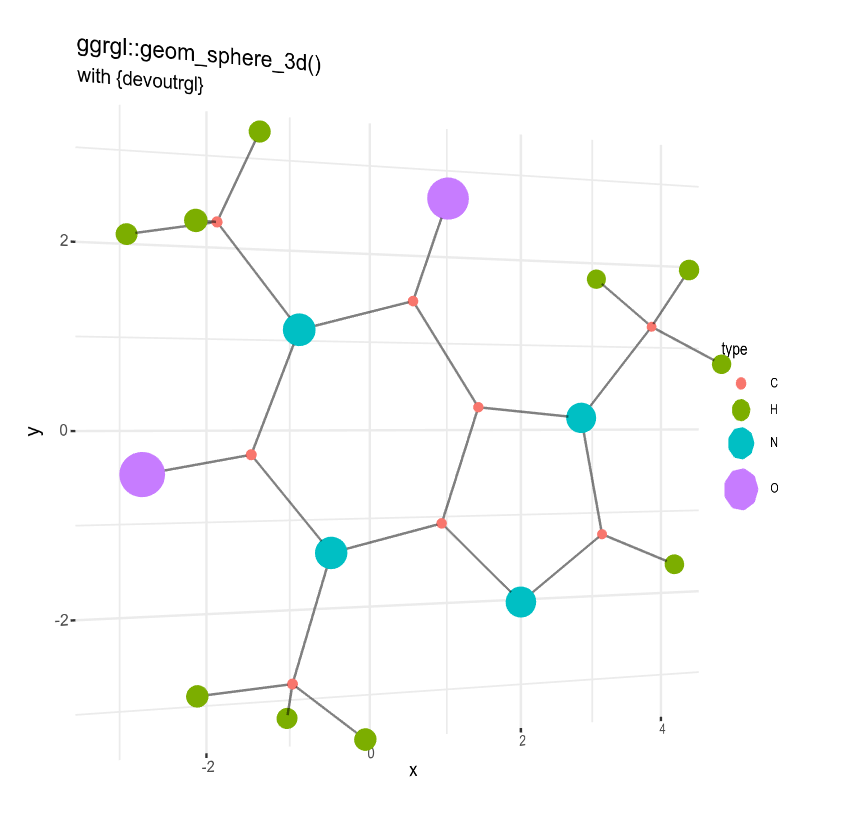
| geom_point | geom_point_z | geom_sphere_3d |
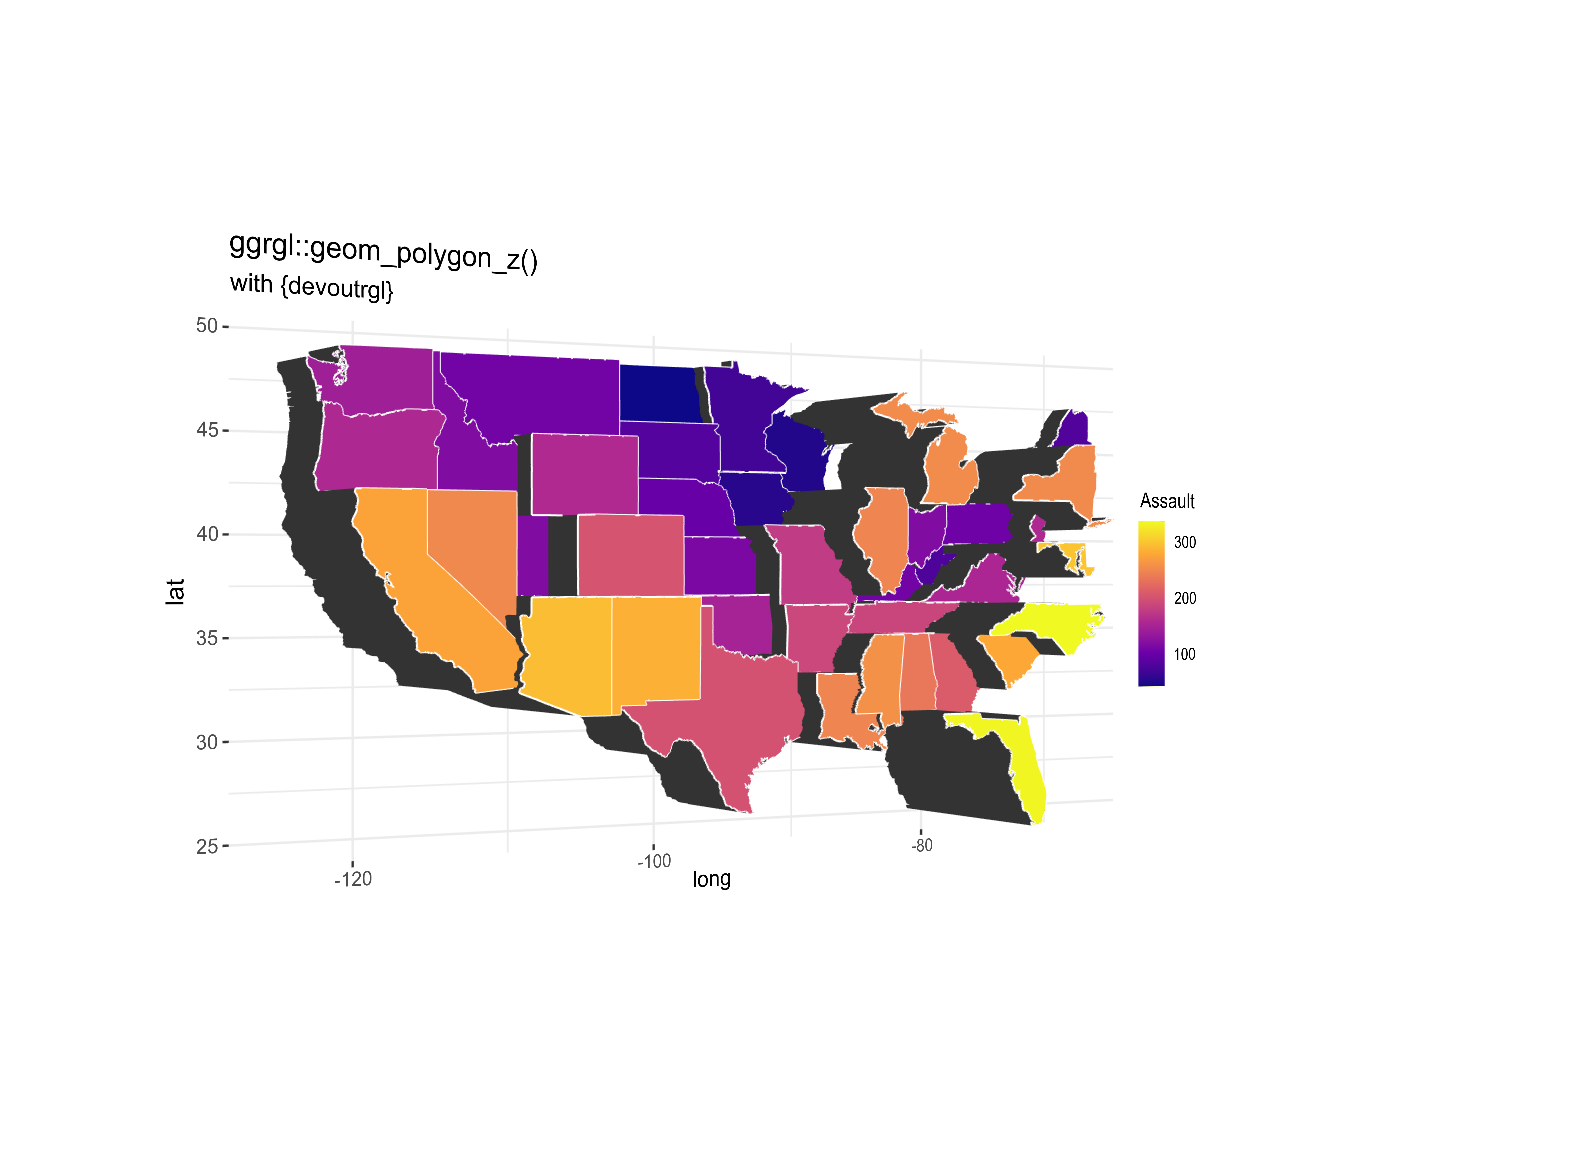
| geom_polygon | geom_polygon_z | |
| geom_rect | geom_rect_z | |
| geom_ribbon | geom_ribbon_z | |
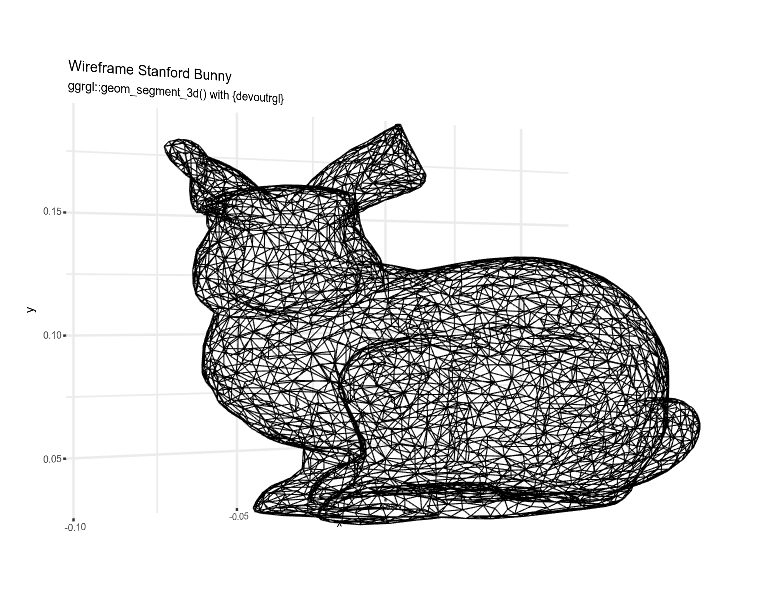
| geom_segment | geom_segment_3d | |
| geom_text | geom_text_z | |
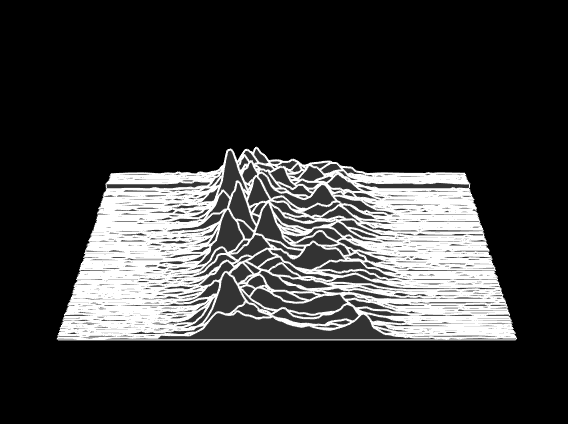
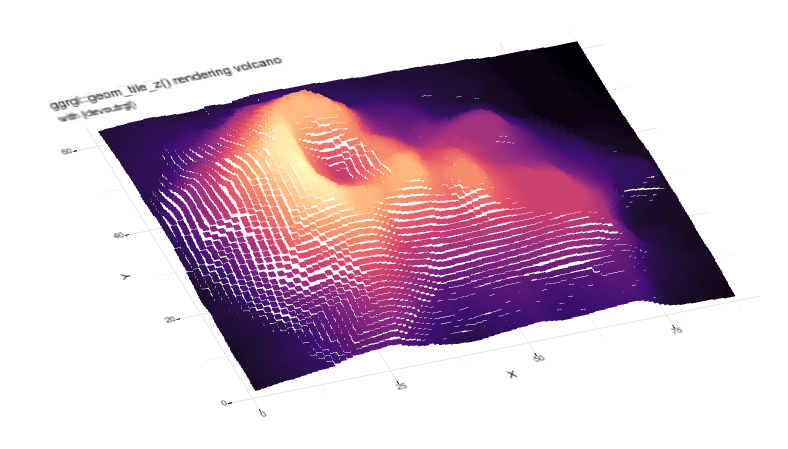
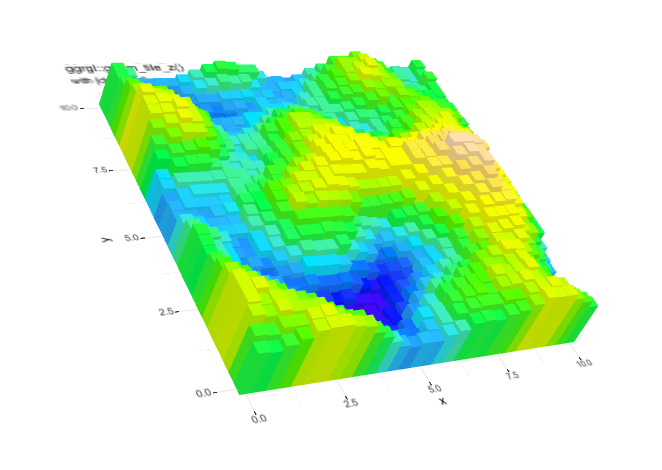
| geom_tile | geom_tile_z |
Vignettes
There are vignettes on all the new geoms in this package, see links in the table above or click on an image below
Some vignettes with some details of the implementation and usage are:
- Technical Overview gives some details on how the 3d geometry is communicated internally
- Z Scaling shows examples how the scaling of the Z coordinate may be controlled.
- Keep 2d ‘shadows’ demonstrates how the 2d shadow of 3d geometry may be kept for some supported geoms.
To see all vignettes see the online documentation
 |
 |
 |
 |
 |
 |
 |
 |
 |
Example - A Basic 3d Bar Plot with geom_bar_z()
#~~~~~~~~~~~~~~~~~~~~~~~~~~~~~~~~~~~~~~~~~~~~~~~~~~~~~~~~~~~~~~~~~~~~~~~~~~~~
# Always explicitly load required packages - there are some possible
# issues if you don't!
#~~~~~~~~~~~~~~~~~~~~~~~~~~~~~~~~~~~~~~~~~~~~~~~~~~~~~~~~~~~~~~~~~~~~~~~~~~~~
suppressPackageStartupMessages({
  library(rgl)
  library(devout)
  library(devoutrgl)
  library(ggrgl)
  library(ggplot2)
})

#~~~~~~~~~~~~~~~~~~~~~~~~~~~~~~~~~~~~~~~~~~~~~~~~~~~~~~~~~~~~~~~~~~~~~~~~~~~~
# Use `geom_bar_z` and set `z` to 200 and use extrusion
#~~~~~~~~~~~~~~~~~~~~~~~~~~~~~~~~~~~~~~~~~~~~~~~~~~~~~~~~~~~~~~~~~~~~~~~~~~~~
p <- ggplot(mpg) +
  geom_bar_z(aes(x=class, fill=class), colour='black', z=200, extrude=TRUE)


#~~~~~~~~~~~~~~~~~~~~~~~~~~~~~~~~~~~~~~~~~~~~~~~~~~~~~~~~~~~~~~~~~~~~~~~~~~~~
# Render Plot in 3d with {devoutrgl}
#~~~~~~~~~~~~~~~~~~~~~~~~~~~~~~~~~~~~~~~~~~~~~~~~~~~~~~~~~~~~~~~~~~~~~~~~~~~~
devoutrgl::rgldev()
p
invisible(dev.off())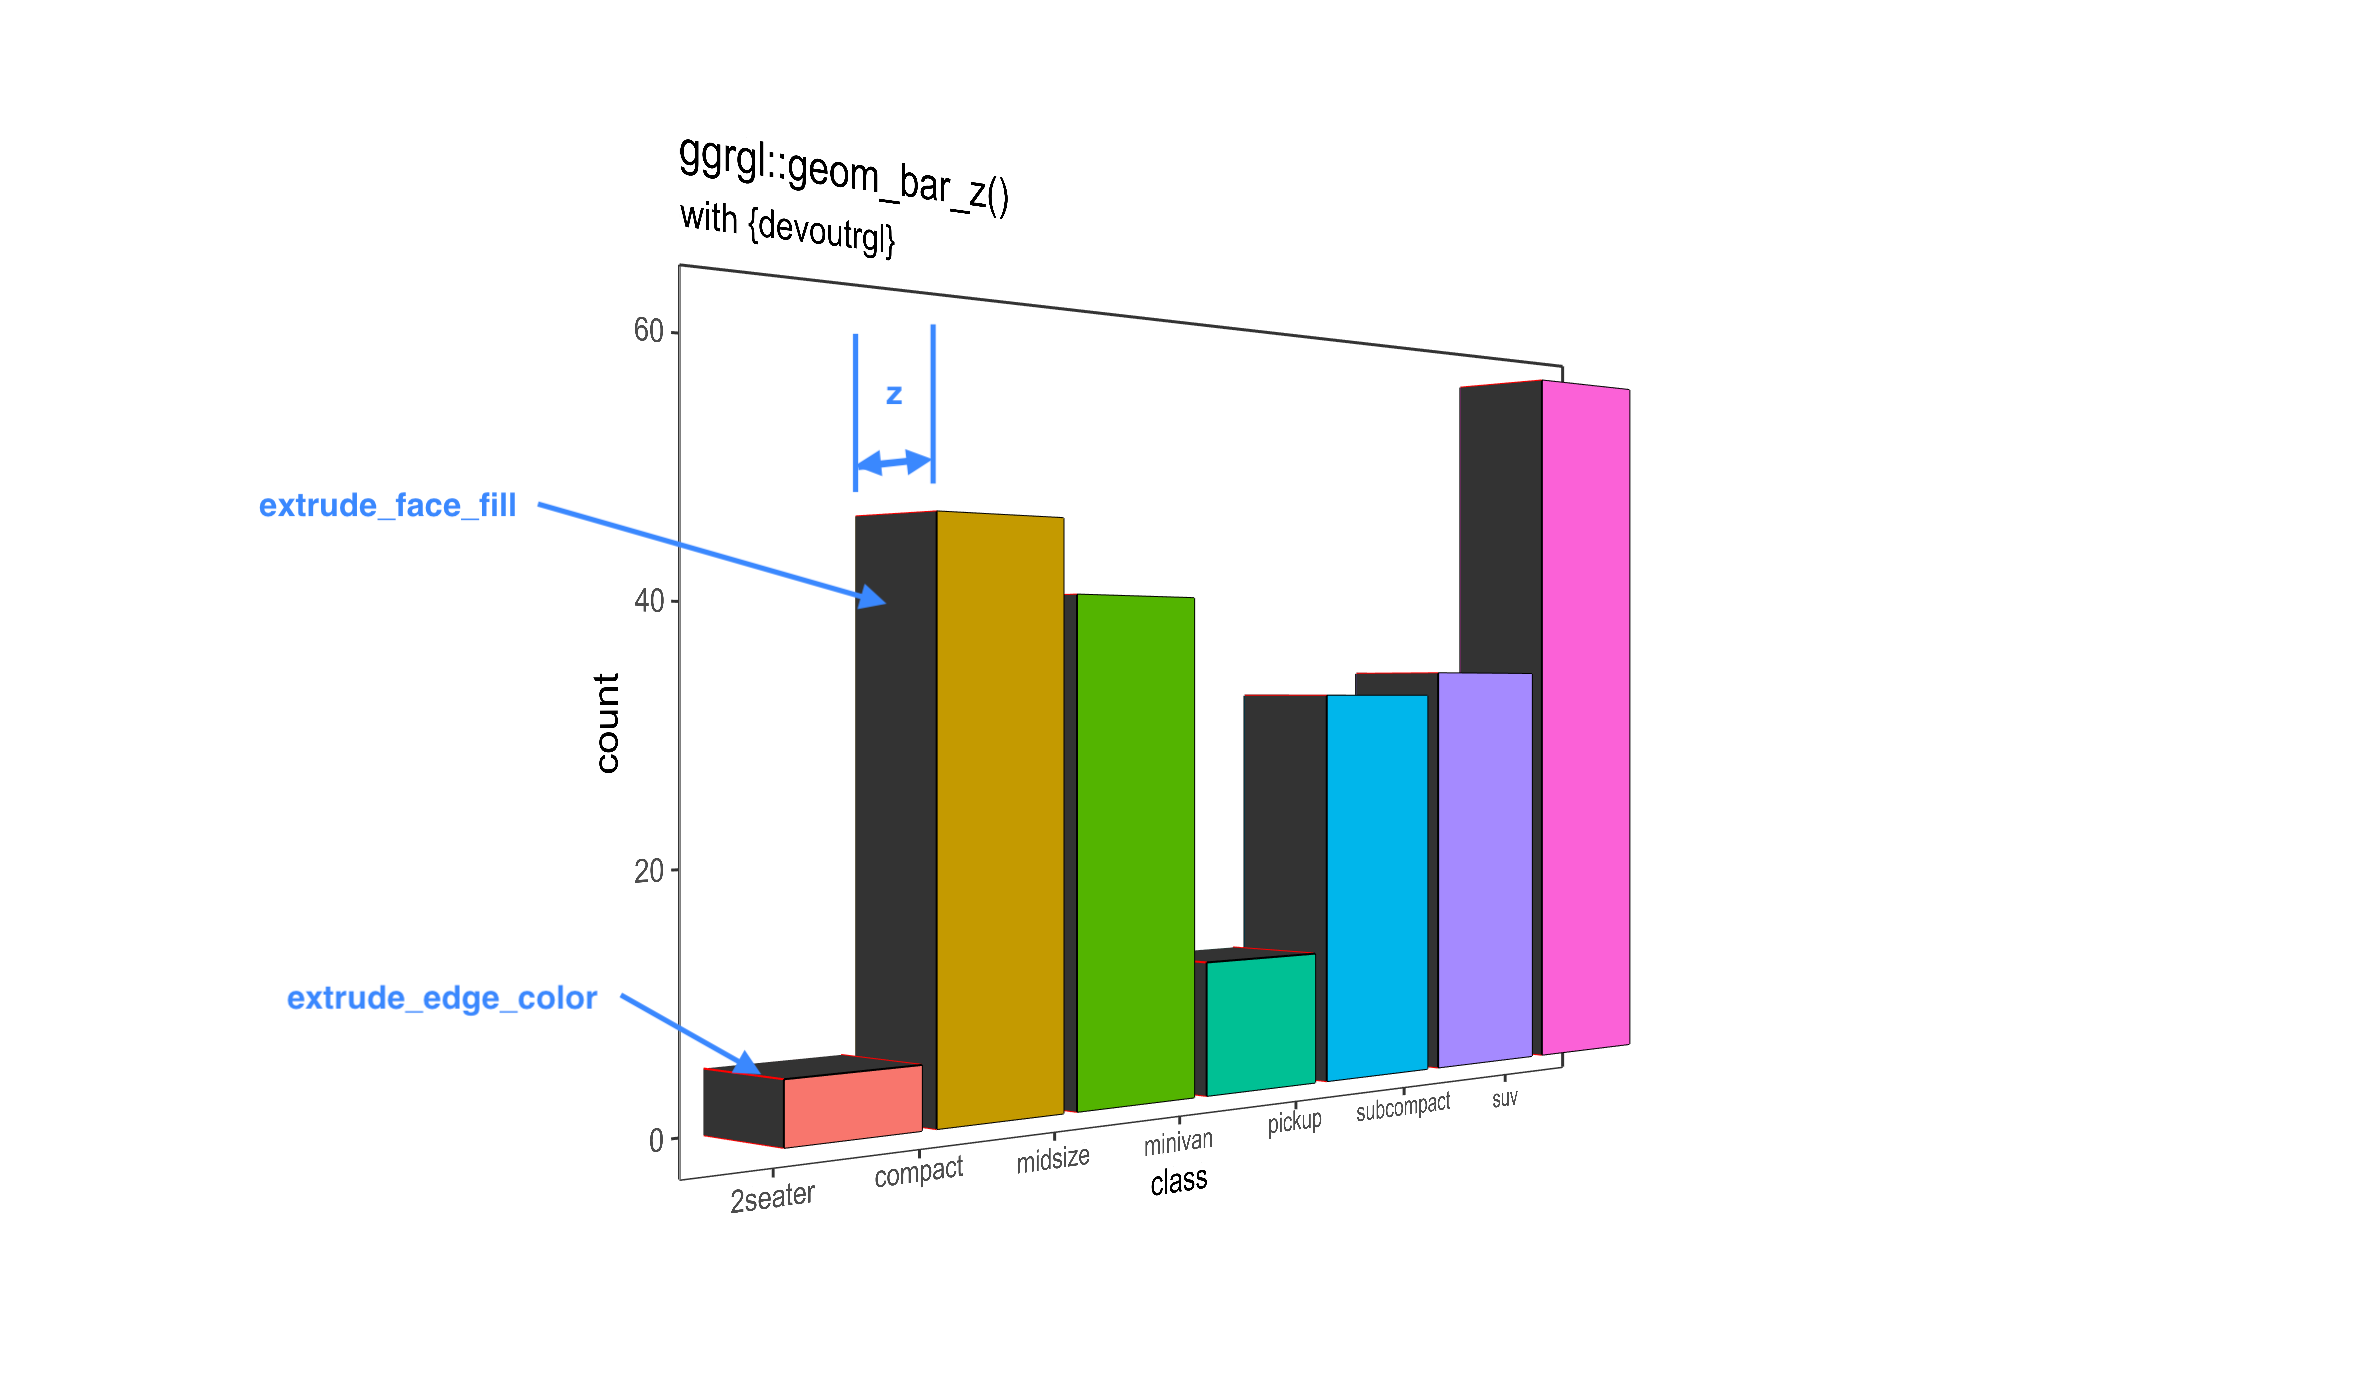
Acknowledgements
- Hadley Wickham, Thomas Lin Pedersen and others for developing and maintaining
ggplot2 - Michael Sumner + Tyler Morgan-Wall on twitter for their in-depth technical advice on graphics and 3d in R
- R Core for developing and maintaining the language.
- CRAN maintainers, for patiently shepherding packages onto CRAN and maintaining the repository