Draw multiple triangles from mesh data
nr_tri_mesh(nr, vertices, indices, color, tris = "all", use_alpha = TRUE)

nr_tri_coords(nr, coords, color, tris = "all", use_alpha = TRUE)
Arguments
- nr
native raster image
- vertices
matrix of vertex coordinates. x,y in columns (wide) or rows (tall). Extra coordinates are ignored i.e. if coordiantes given as (x, y, z) or (x, y, z, w), only the first two coordinates will be used for plotting.
- indices
integer matrix of index information. 3 indices per triangle - either in one-triangle-per-matrix_row (tall) or one-triangle-per-matrix-column (wide)
- color
color specification. Single color or one color per tri
- tris
Which triangles should be drawn? Valid options: 'all' (default), 'ccw', 'cw'. The options 'ccw' and 'cw' limit plotting to those triangles where the order of the vertices are defined in a counter-clockwise or clockwise manner respectively. Note: when considering orientation or triangles remmeber that the y-axis is defined vertically down the screen.
- use_alpha
Use alpha channel when drawing? Logical. Default: TRUE
- coords
Numeric atrix of direct coordinate data for each triangle. The coordinates for each vertex are in columns. Each group of 3 columns defines one triangle. There may be extra rows in the matrix, but only the first two will be used (as x and y respectively)
Value
Invisibly return the supplied native raster image which was been modified in-place
See also
Other drawing functions:
nr_circle(),
nr_polygon(),
nr_polyline(),
nr_rect()
Examples
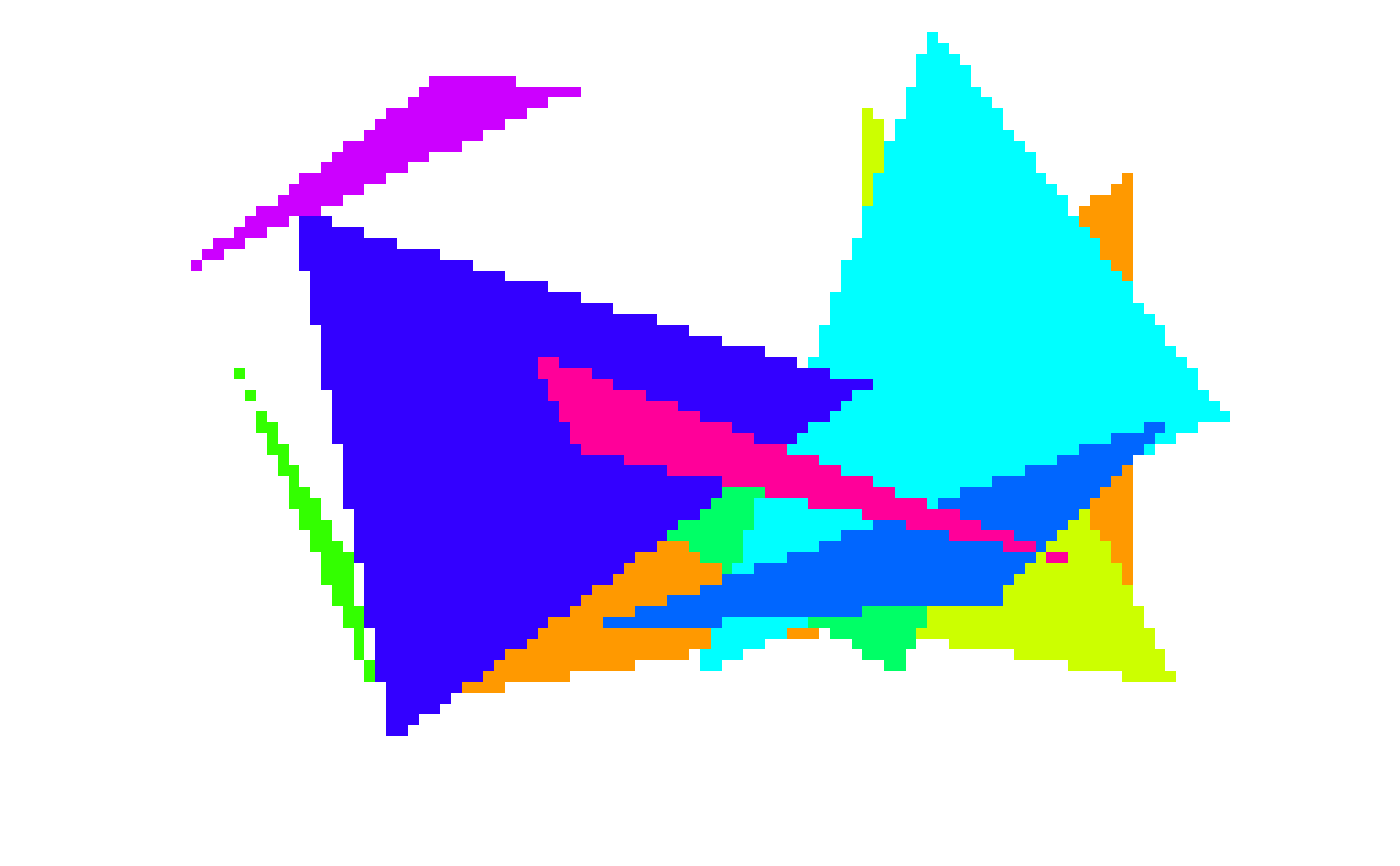
#' Using direct coordinates
set.seed(1)
w <- 100
h <- 80
nr <- nr_new(w, h)
n_tri <- 10
xs <- runif(n_tri * 3, 0, w - 1)
ys <- runif(n_tri * 3, 0, h - 1)
coords <- rbind(xs, ys)
cols <- rainbow(n_tri)
nr_tri_coords(nr, coords, cols, tris = 'all')
plot(nr)
 # Using a standard mesh structure
# i.e. a matrix of vertices, and a matrix of indices
nr <- nr_new(w, h)
# Matrix of coordinates
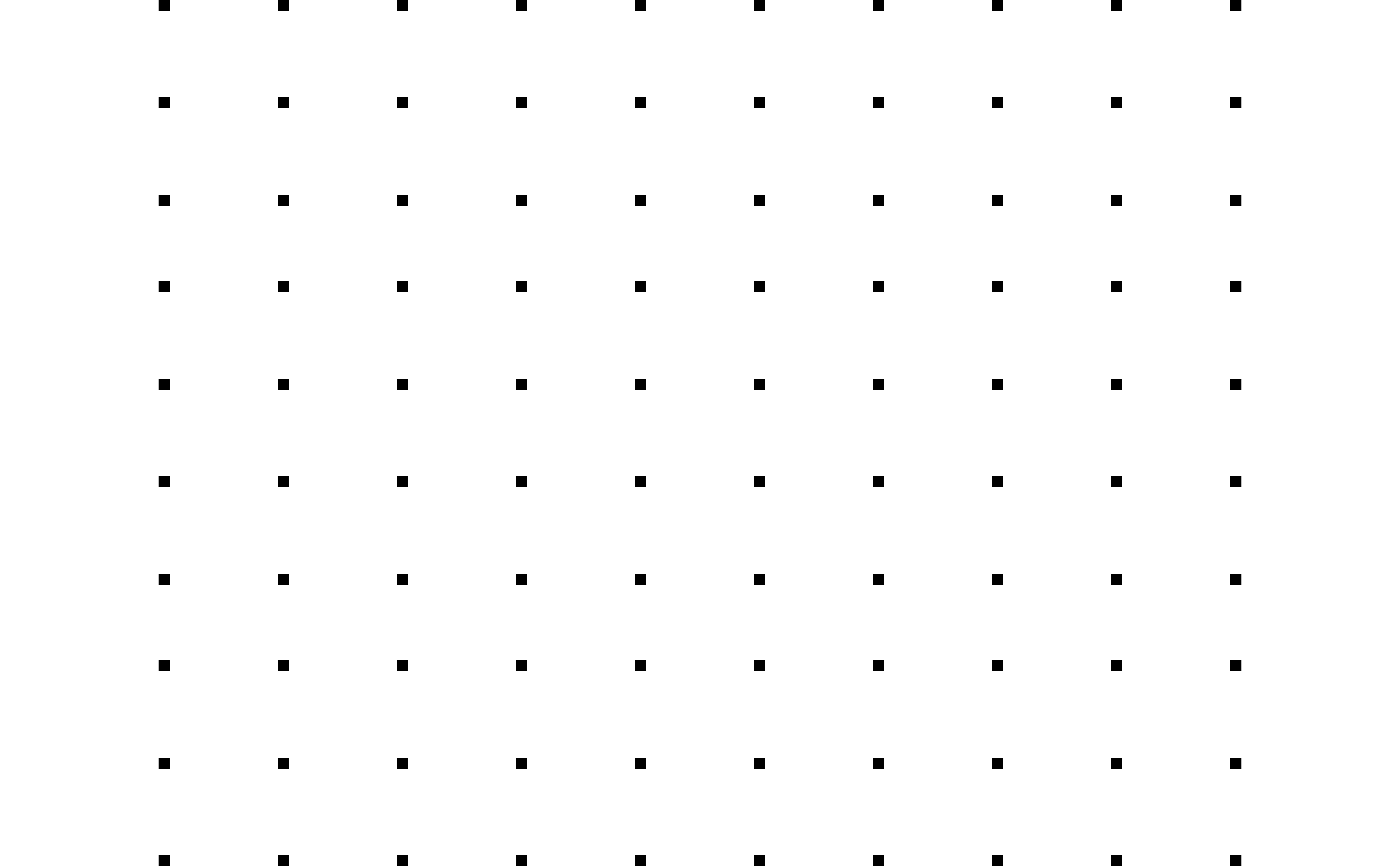
xs <- rep(seq(0, w - 1, length.out = 10), 10)
ys <- rep(seq(0, h - 1, length.out = 10), each = 10)
vertices <- rbind(xs, ys)
nr_point(nr, xs, ys)
plot(nr)
# Using a standard mesh structure
# i.e. a matrix of vertices, and a matrix of indices
nr <- nr_new(w, h)
# Matrix of coordinates
xs <- rep(seq(0, w - 1, length.out = 10), 10)
ys <- rep(seq(0, h - 1, length.out = 10), each = 10)
vertices <- rbind(xs, ys)
nr_point(nr, xs, ys)
plot(nr)
 # Matrix of idices indicating which vertices make up each triangle
indices <- matrix(sample(length(xs), 3 * n_tri), nrow = 3)
nr_tri_mesh(nr, vertices, indices, cols, tris = 'all')
# Matrix of idices indicating which vertices make up each triangle
indices <- matrix(sample(length(xs), 3 * n_tri), nrow = 3)
nr_tri_mesh(nr, vertices, indices, cols, tris = 'all')
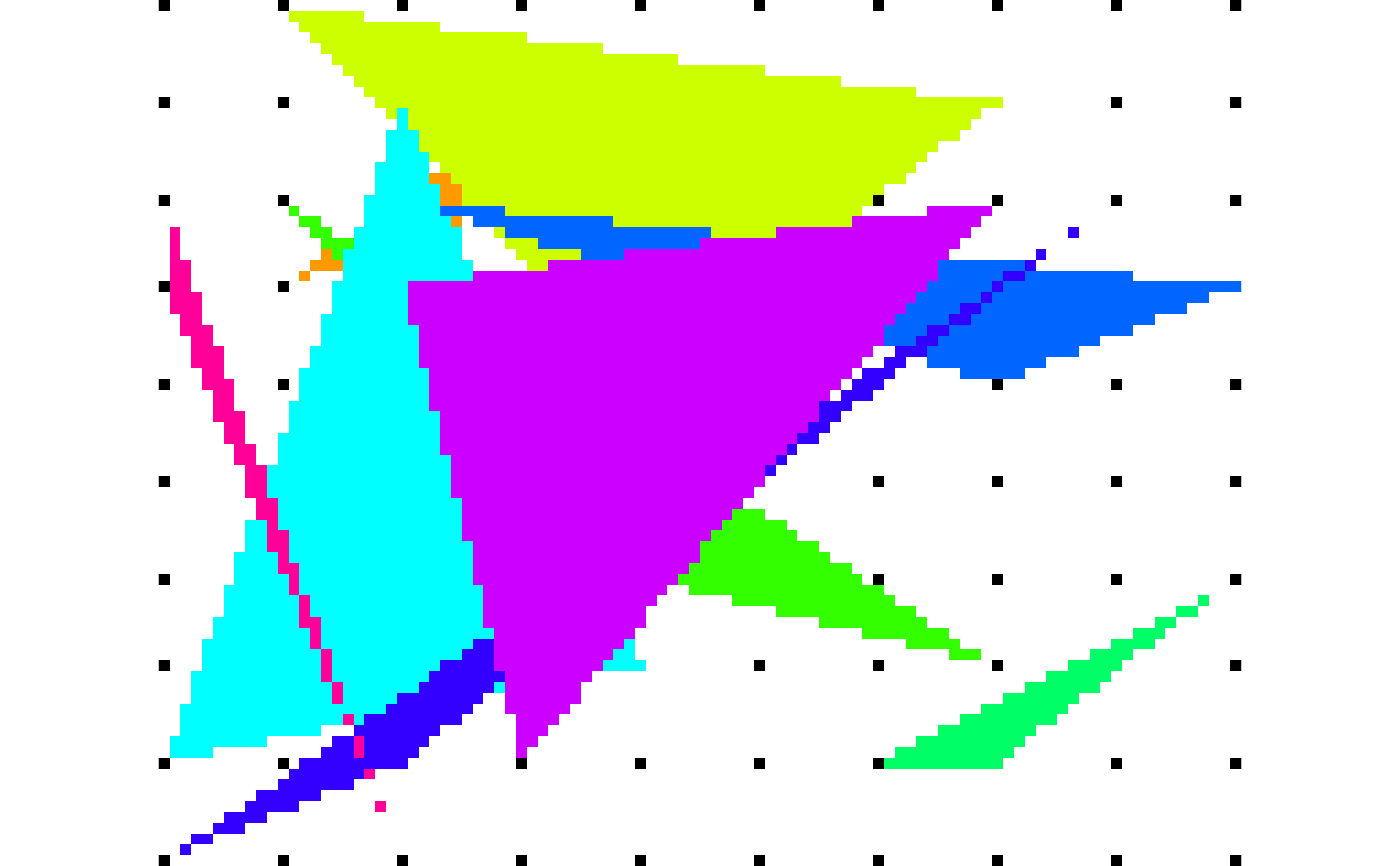 #> tris: 10 indices: 30 verts: 100
plot(nr)
#> tris: 10 indices: 30 verts: 100
plot(nr)
