Each geom has an associated function that draws the key when the geom needs
to be displayed in a legend. These functions are called draw_key_*(), where
* stands for the name of the respective key glyph. The key glyphs can be
customized for individual geoms by providing a geom with the key_glyph
argument (see layer() or examples below.)
draw_key_polygon_pattern(data, params, size, aspect_ratio = 1)

draw_key_boxplot_pattern(data, params, size, aspect_ratio = 1)

draw_key_crossbar_pattern(data, params, size, aspect_ratio = 1)
Arguments
- data
A single row data frame containing the scaled aesthetics to display in this key
- params
A list of additional parameters supplied to the geom.
- size
Width and height of key in mm.
- aspect_ratio
the geom's best guess at what the aspect ratio might be.
Value
A grid grob.
Examples
if (require("ggplot2")) {
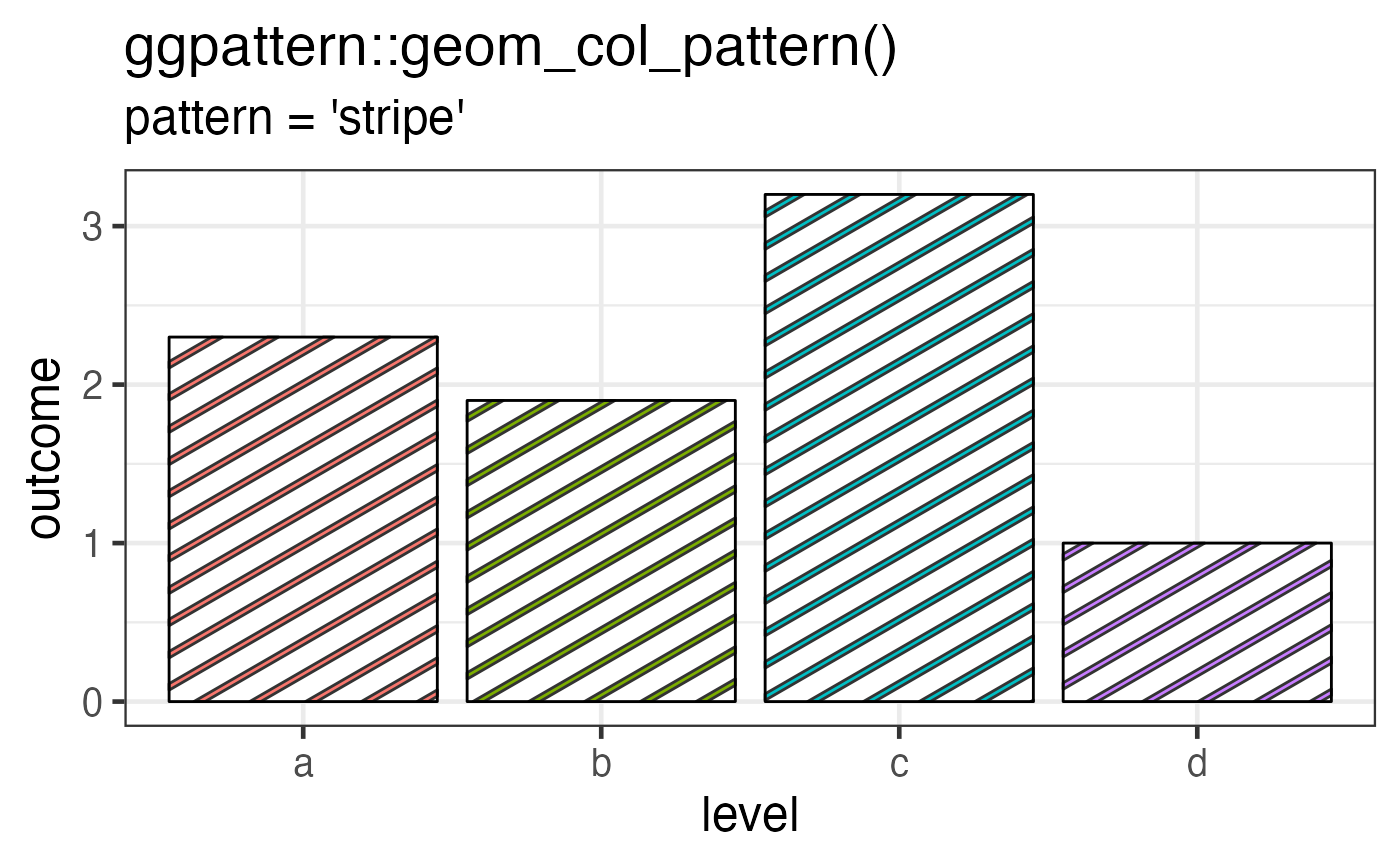
# 'stripe' pattern example
df <- data.frame(level = c("a", "b", "c", 'd'), outcome = c(2.3, 1.9, 3.2, 1))
gg <- ggplot(df) +
geom_col_pattern(
aes(level, outcome, pattern_fill = level),
pattern = 'stripe',
fill = 'white',
colour = 'black',
key_glyph = draw_key_polygon_pattern
) +
theme_bw(18) +
theme(legend.position = 'none') +
labs(
title = "ggpattern::geom_col_pattern()",
subtitle = "pattern = 'stripe'"
)
plot(gg)
}
#> Loading required package: ggplot2