Viridis colour scales from viridisLite
Source:R/scale-pattern-viridis.R, R/zxx.r
scale_pattern_colour_viridis_d.RdThe viridis scales provide colour maps that are perceptually uniform in both
colour and black-and-white. They are also designed to be perceived by viewers
with common forms of colour blindness. See also
https://bids.github.io/colormap/.
scale_pattern_colour_viridis_d(
  ...,
  alpha = 1,
  begin = 0,
  end = 1,
  direction = 1,
  option = "D",
  aesthetics = "pattern_colour"
)

scale_pattern_fill_viridis_d(
  ...,
  alpha = 1,
  begin = 0,
  end = 1,
  direction = 1,
  option = "D",
  aesthetics = "pattern_fill"
)

scale_pattern_fill2_viridis_d(
  ...,
  alpha = 1,
  begin = 0,
  end = 1,
  direction = 1,
  option = "D",
  aesthetics = "pattern_fill2"
)

scale_pattern_colour_viridis_c(
  ...,
  alpha = 1,
  begin = 0,
  end = 1,
  direction = 1,
  option = "D",
  values = NULL,
  space = "Lab",
  na.value = "grey50",
  guide = guide_colourbar(available_aes = "pattern_colour"),
  aesthetics = "pattern_colour"
)

scale_pattern_fill_viridis_c(
  ...,
  alpha = 1,
  begin = 0,
  end = 1,
  direction = 1,
  option = "D",
  values = NULL,
  space = "Lab",
  na.value = "grey50",
  guide = guide_colourbar(available_aes = "pattern_fill"),
  aesthetics = "pattern_fill"
)

scale_pattern_fill2_viridis_c(
  ...,
  alpha = 1,
  begin = 0,
  end = 1,
  direction = 1,
  option = "D",
  values = NULL,
  space = "Lab",
  na.value = "grey50",
  guide = guide_colourbar(available_aes = "pattern_fill2"),
  aesthetics = "pattern_fill2"
)
Arguments
- ...
Other arguments passed on to
discrete_scale(),continuous_scale(), or binned_scale to control name, limits, breaks, labels and so forth.- begin, end, alpha, direction, option, values, space, na.value, guide
See
ggplot2::scale_colour_viridis_dfor more information- aesthetics
Character string or vector of character strings listing the name(s) of the aesthetic(s) that this scale works with. This can be useful, for example, to apply colour settings to the
colourandfillaesthetics at the same time, viaaesthetics = c("colour", "fill").
Value
A ggplot2::Scale object.
Examples
if (require("ggplot2")) {
df <- data.frame(level = c("a", "b", "c", "d"),
outcome = c(2.3, 1.9, 3.2, 1))
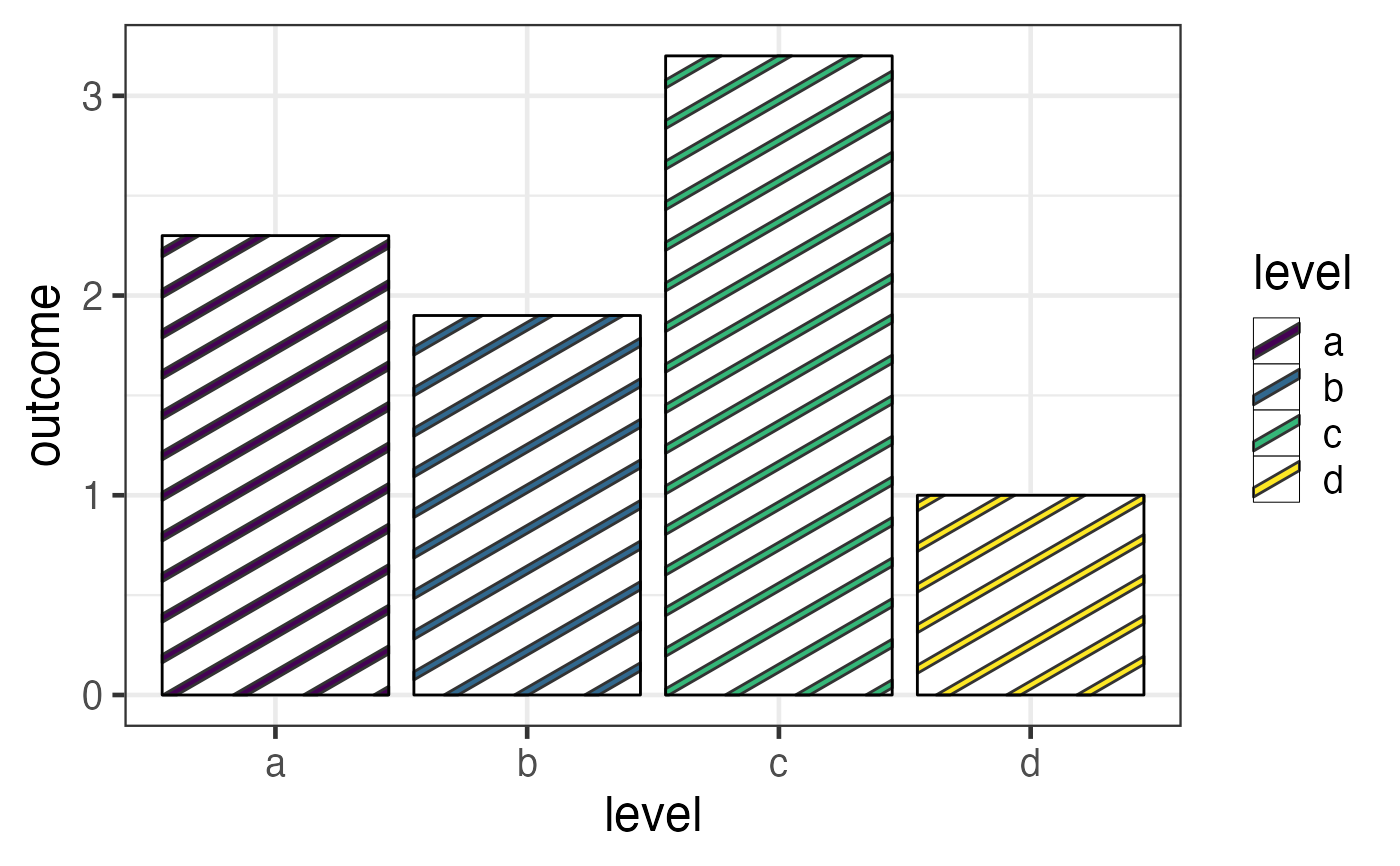
# discrete 'viridis' palette
gg <- ggplot(df) +
geom_col_pattern(
aes(level, outcome, pattern_fill = level),
pattern = 'stripe',
fill = 'white',
colour = 'black'
) +
theme_bw(18) +
scale_pattern_fill_viridis_d()
plot(gg)
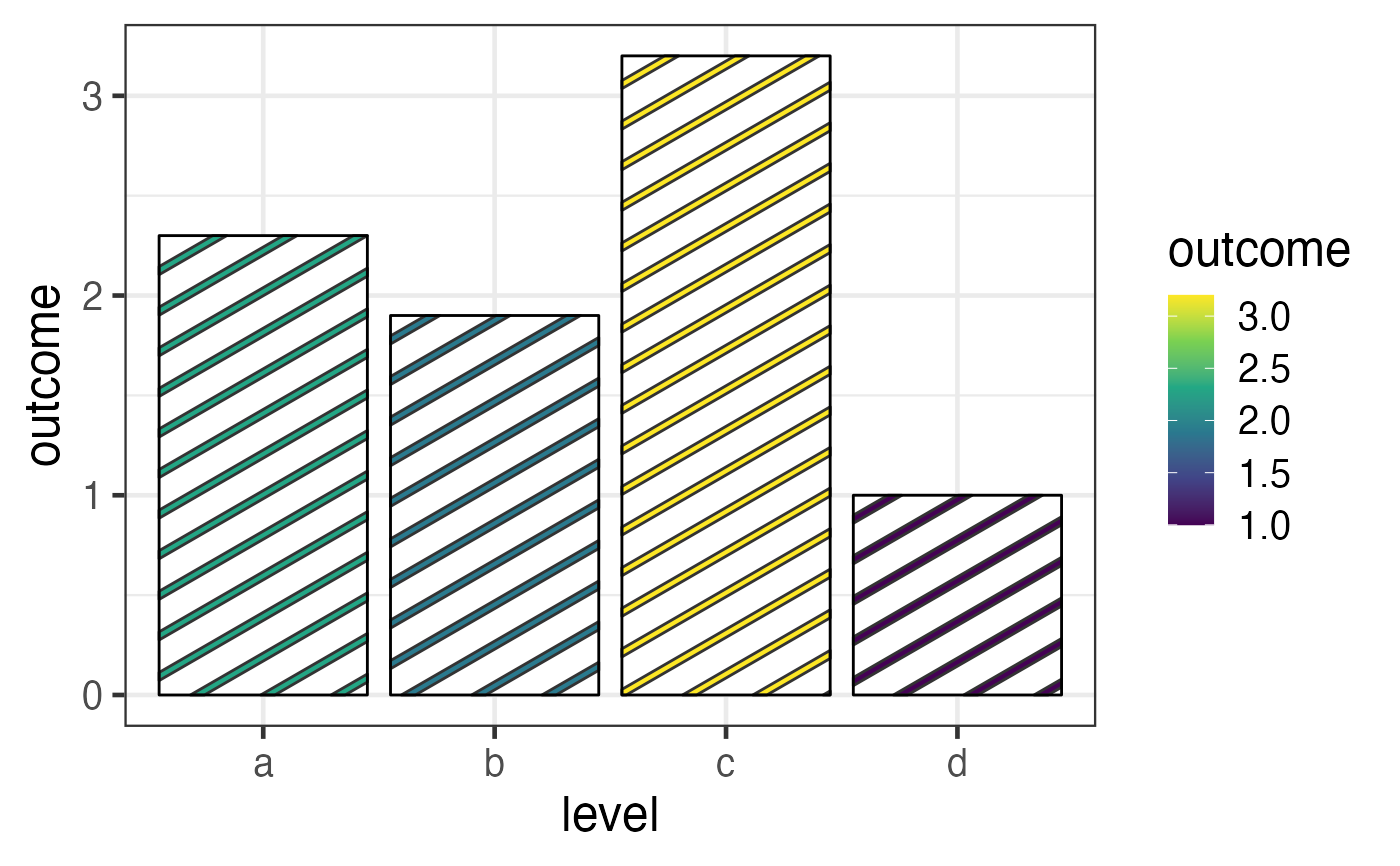
# continuous 'viridis' palette
gg <- ggplot(df) +
geom_col_pattern(
aes(level, outcome, pattern_fill = outcome),
pattern = 'stripe',
fill = 'white',
colour = 'black'
) +
theme_bw(18) +
scale_pattern_fill_viridis_c()
plot(gg)
}