Animated Stroke Rendering
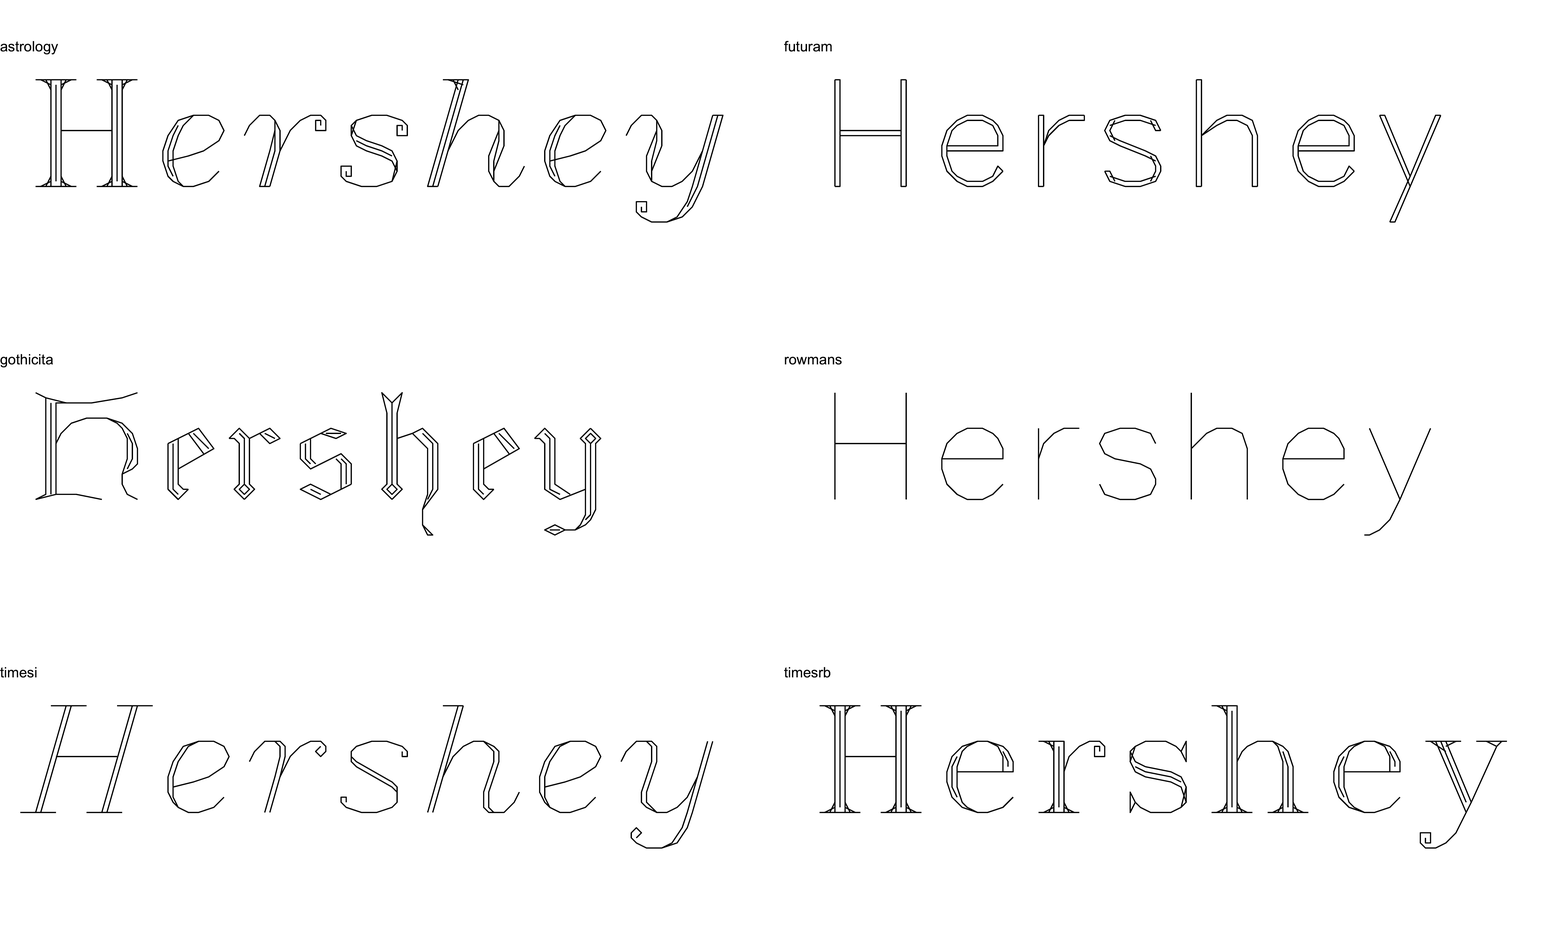
animated-stroke-rendering.RmdSlideshow of all fonts
library(ggplot2)

#~~~~~~~~~~~~~~~~~~~~~~~~~~~~~~~~~~~~~~~~~~~~~~~~~~~~~~~~~~~~~~~~~~~~~~~~~~~~~
# Only include fonts that have ASCII characters which make sense for this
#~~~~~~~~~~~~~~~~~~~~~~~~~~~~~~~~~~~~~~~~~~~~~~~~~~~~~~~~~~~~~~~~~~~~~~~~~~~~~
fontnames <- unique(hershey$font)
fontnames <- setdiff(fontnames, c('japanese', 'japanese2', 'markers', 'mathlow',
                                  'mathupp', 'symbolic', 'gothitt', 'greek',
                                  'greekc', 'greeks', 'timesg', 'cyrilc_1',
                                  'cyrillic', 'gothgrt', 'gothgbt', 'scripts'))

for (idx in seq_along(fontnames)) {
  text <- 'Hershey'
  font <- fontnames[idx]
  print(font)

  string_df <- create_string_df(text = text, font = font)

  p <- ggplot(string_df) +
    geom_path(aes(x, y, group = interaction(char_idx, stroke))) +
    coord_equal(xlim = c(-10, 130), ylim = c(-25, 15)) +
    theme_void() +
    labs(title = font)

  filename <- paste0("man/figures/fontname/", font, ".png")
  ggsave(filename, p, width = 10, height = 4)
}
stroke-by-stroke rendering
#~~~~~~~~~~~~~~~~~~~~~~~~~~~~~~~~~~~~~~~~~~~~~~~~~~~~~~~~~~~~~~~~~~~~~~~~~~~~~
# Create a data.frame of strokes to render
#~~~~~~~~~~~~~~~~~~~~~~~~~~~~~~~~~~~~~~~~~~~~~~~~~~~~~~~~~~~~~~~~~~~~~~~~~~~~~
text <- 'Hershey'
font <- 'cursive'
string_df <- create_string_df(text = text, font = font)

#~~~~~~~~~~~~~~~~~~~~~~~~~~~~~~~~~~~~~~~~~~~~~~~~~~~~~~~~~~~~~~~~~~~~~~~~~~~~~
# Render strokes 2 at a time (to keep the final gif size down)
#~~~~~~~~~~~~~~~~~~~~~~~~~~~~~~~~~~~~~~~~~~~~~~~~~~~~~~~~~~~~~~~~~~~~~~~~~~~~~
for (ii in seq(1, nrow(string_df), 2)) {
  plot_df <- string_df %>% slice(seq(ii))

  p <- ggplot(plot_df) +
    geom_path(aes(x, y, group = interaction(char_idx, stroke))) +
    coord_equal(xlim = c(-10, 80), ylim = c(-25, 15)) +
    theme_void()

  filename <- sprintf("man/figures/fontdraw/%s-%03i.png", font, ii)
  ggsave(filename, p, width = 6, height = 2)
}
Animated reveal
#~~~~~~~~~~~~~~~~~~~~~~~~~~~~~~~~~~~~~~~~~~~~~~~~~~~~~~~~~~~~~~~~~~~~~~~~~~~~~
# Create a data.frame of all strokes to render
#~~~~~~~~~~~~~~~~~~~~~~~~~~~~~~~~~~~~~~~~~~~~~~~~~~~~~~~~~~~~~~~~~~~~~~~~~~~~~
text <- 'Hershey'
font <- 'timesrb'
string_df <- create_string_df(text = text, font = font)

#~~~~~~~~~~~~~~~~~~~~~~~~~~~~~~~~~~~~~~~~~~~~~~~~~~~~~~~~~~~~~~~~~~~~~~~~~~~~~
# Within each character, calculate the 'scale' of each point as the fraction
# of the total points in that character.
#~~~~~~~~~~~~~~~~~~~~~~~~~~~~~~~~~~~~~~~~~~~~~~~~~~~~~~~~~~~~~~~~~~~~~~~~~~~~~
string_df %<>% group_by(char_idx) %>% mutate(scale = row_number()/n()) %>% ungroup()


#~~~~~~~~~~~~~~~~~~~~~~~~~~~~~~~~~~~~~~~~~~~~~~~~~~~~~~~~~~~~~~~~~~~~~~~~~~~~~
# Render the entire set of points in 25 steps
#~~~~~~~~~~~~~~~~~~~~~~~~~~~~~~~~~~~~~~~~~~~~~~~~~~~~~~~~~~~~~~~~~~~~~~~~~~~~~
for (ii in seq(0, 1, length.out = 25)) {
  plot_df <- string_df %>% filter(scale <= ii)

  p <- ggplot(plot_df) +
    geom_path(aes(x, y, group = interaction(char_idx, stroke))) +
    coord_equal(xlim = c(-10, 130), ylim = c(-25, 15)) +
    theme_void()

  filename <- sprintf("man/figures/fontdraw2/%s-%03i.png", font, round(ii * 100))
  ggsave(filename, p, width = 6, height = 1.5)
}