The hershey package contains the Hershey vector fonts in a number of formats for more convenient use within Rstats.
The Hershey fonts were developed in the 1960s. Each glyph is defined as collections of staight line segments - hand calculated by Hershey by sketching them on grid paper!
This package makes available the coordinates of the stroke endpoints for every glyph.
You may need this package if:
- you like retro vector fonts
- you need a vector font so you can have complete control of the output
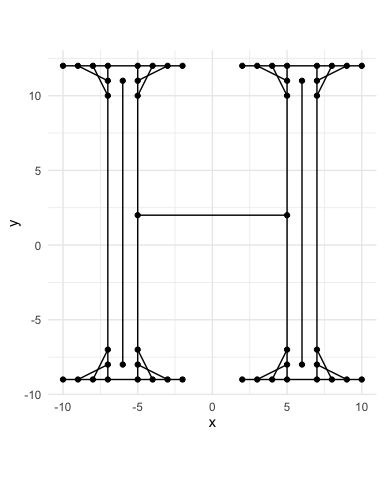
Slideshow (click to open/close)
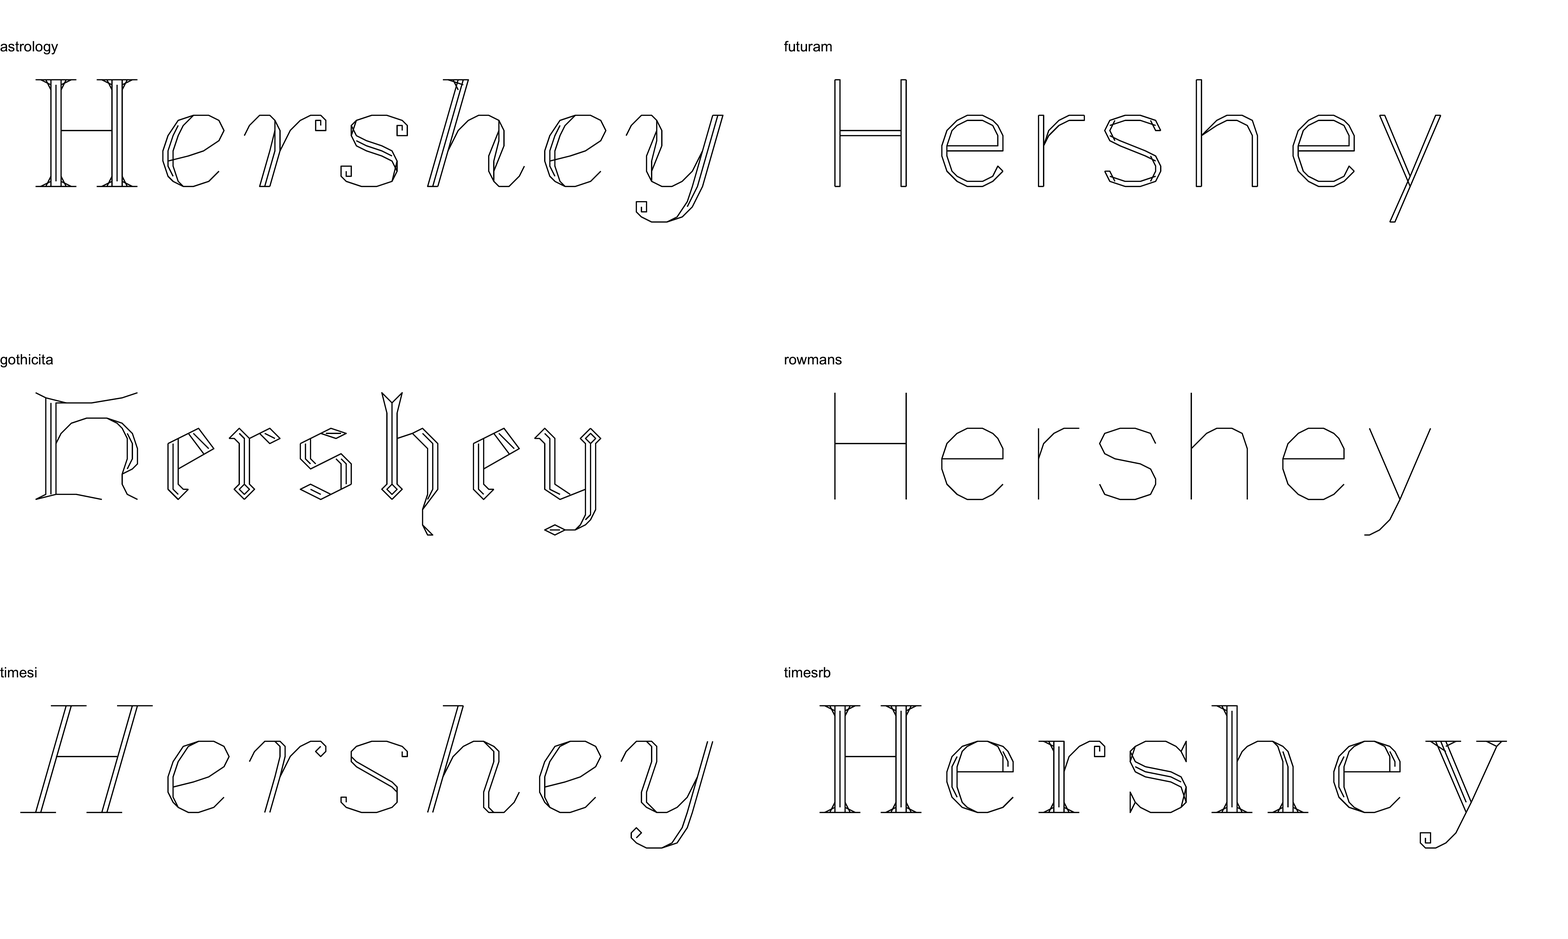
Animated Rendering 1 (click to open/close)

Animated Rendering 2 (click to open/close)

Installation
You can install the development version from GitHub with:
What’s in the box:
-
hershey_raw: the original encoding for every glyph (See the vignette for how to parse). -
hershey: a data.frame of the vector strokes for every glyph. -
hershey_svg: a list of SVG paths for every glyph.
Vignettes
Glyph Representations
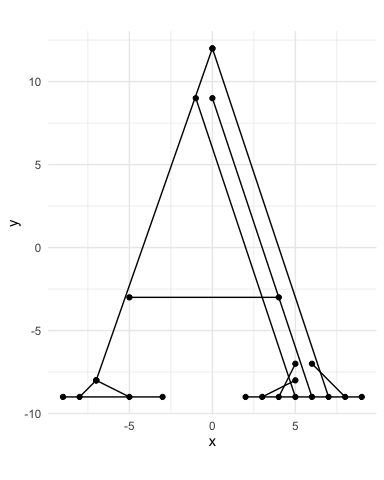
The following are examples of the representation of the letter A (glyph 34 in the rowmant font)
hershey - First 4 strokes in the data.frame representation
#> # A tibble: 8 x 11
#>       x     y  left right width stroke   idx glyph font    ascii char
#>   <int> <int> <int> <int> <int> <fct>  <int> <int> <chr>   <int> <chr>
#> 1     0    12   -10    10    20 0          1    34 rowmant    65 A
#> 2    -7    -8   -10    10    20 0          2    34 rowmant    65 A
#> 3    -1     9   -10    10    20 1          3    34 rowmant    65 A
#> 4     5    -9   -10    10    20 1          4    34 rowmant    65 A
#> 5     0     9   -10    10    20 2          5    34 rowmant    65 A
#> 6     6    -9   -10    10    20 2          6    34 rowmant    65 A
#> 7     0    12   -10    10    20 3          7    34 rowmant    65 A
#> 8 7 -9 -10 10 20 3 8 34 rowmant 65 AFont Sample Sheets
Font sample sheets show the representation of every glyph in a font. Click to view the sample sheets for every font in PDF format.
Example font: Cursive (click to reveal)
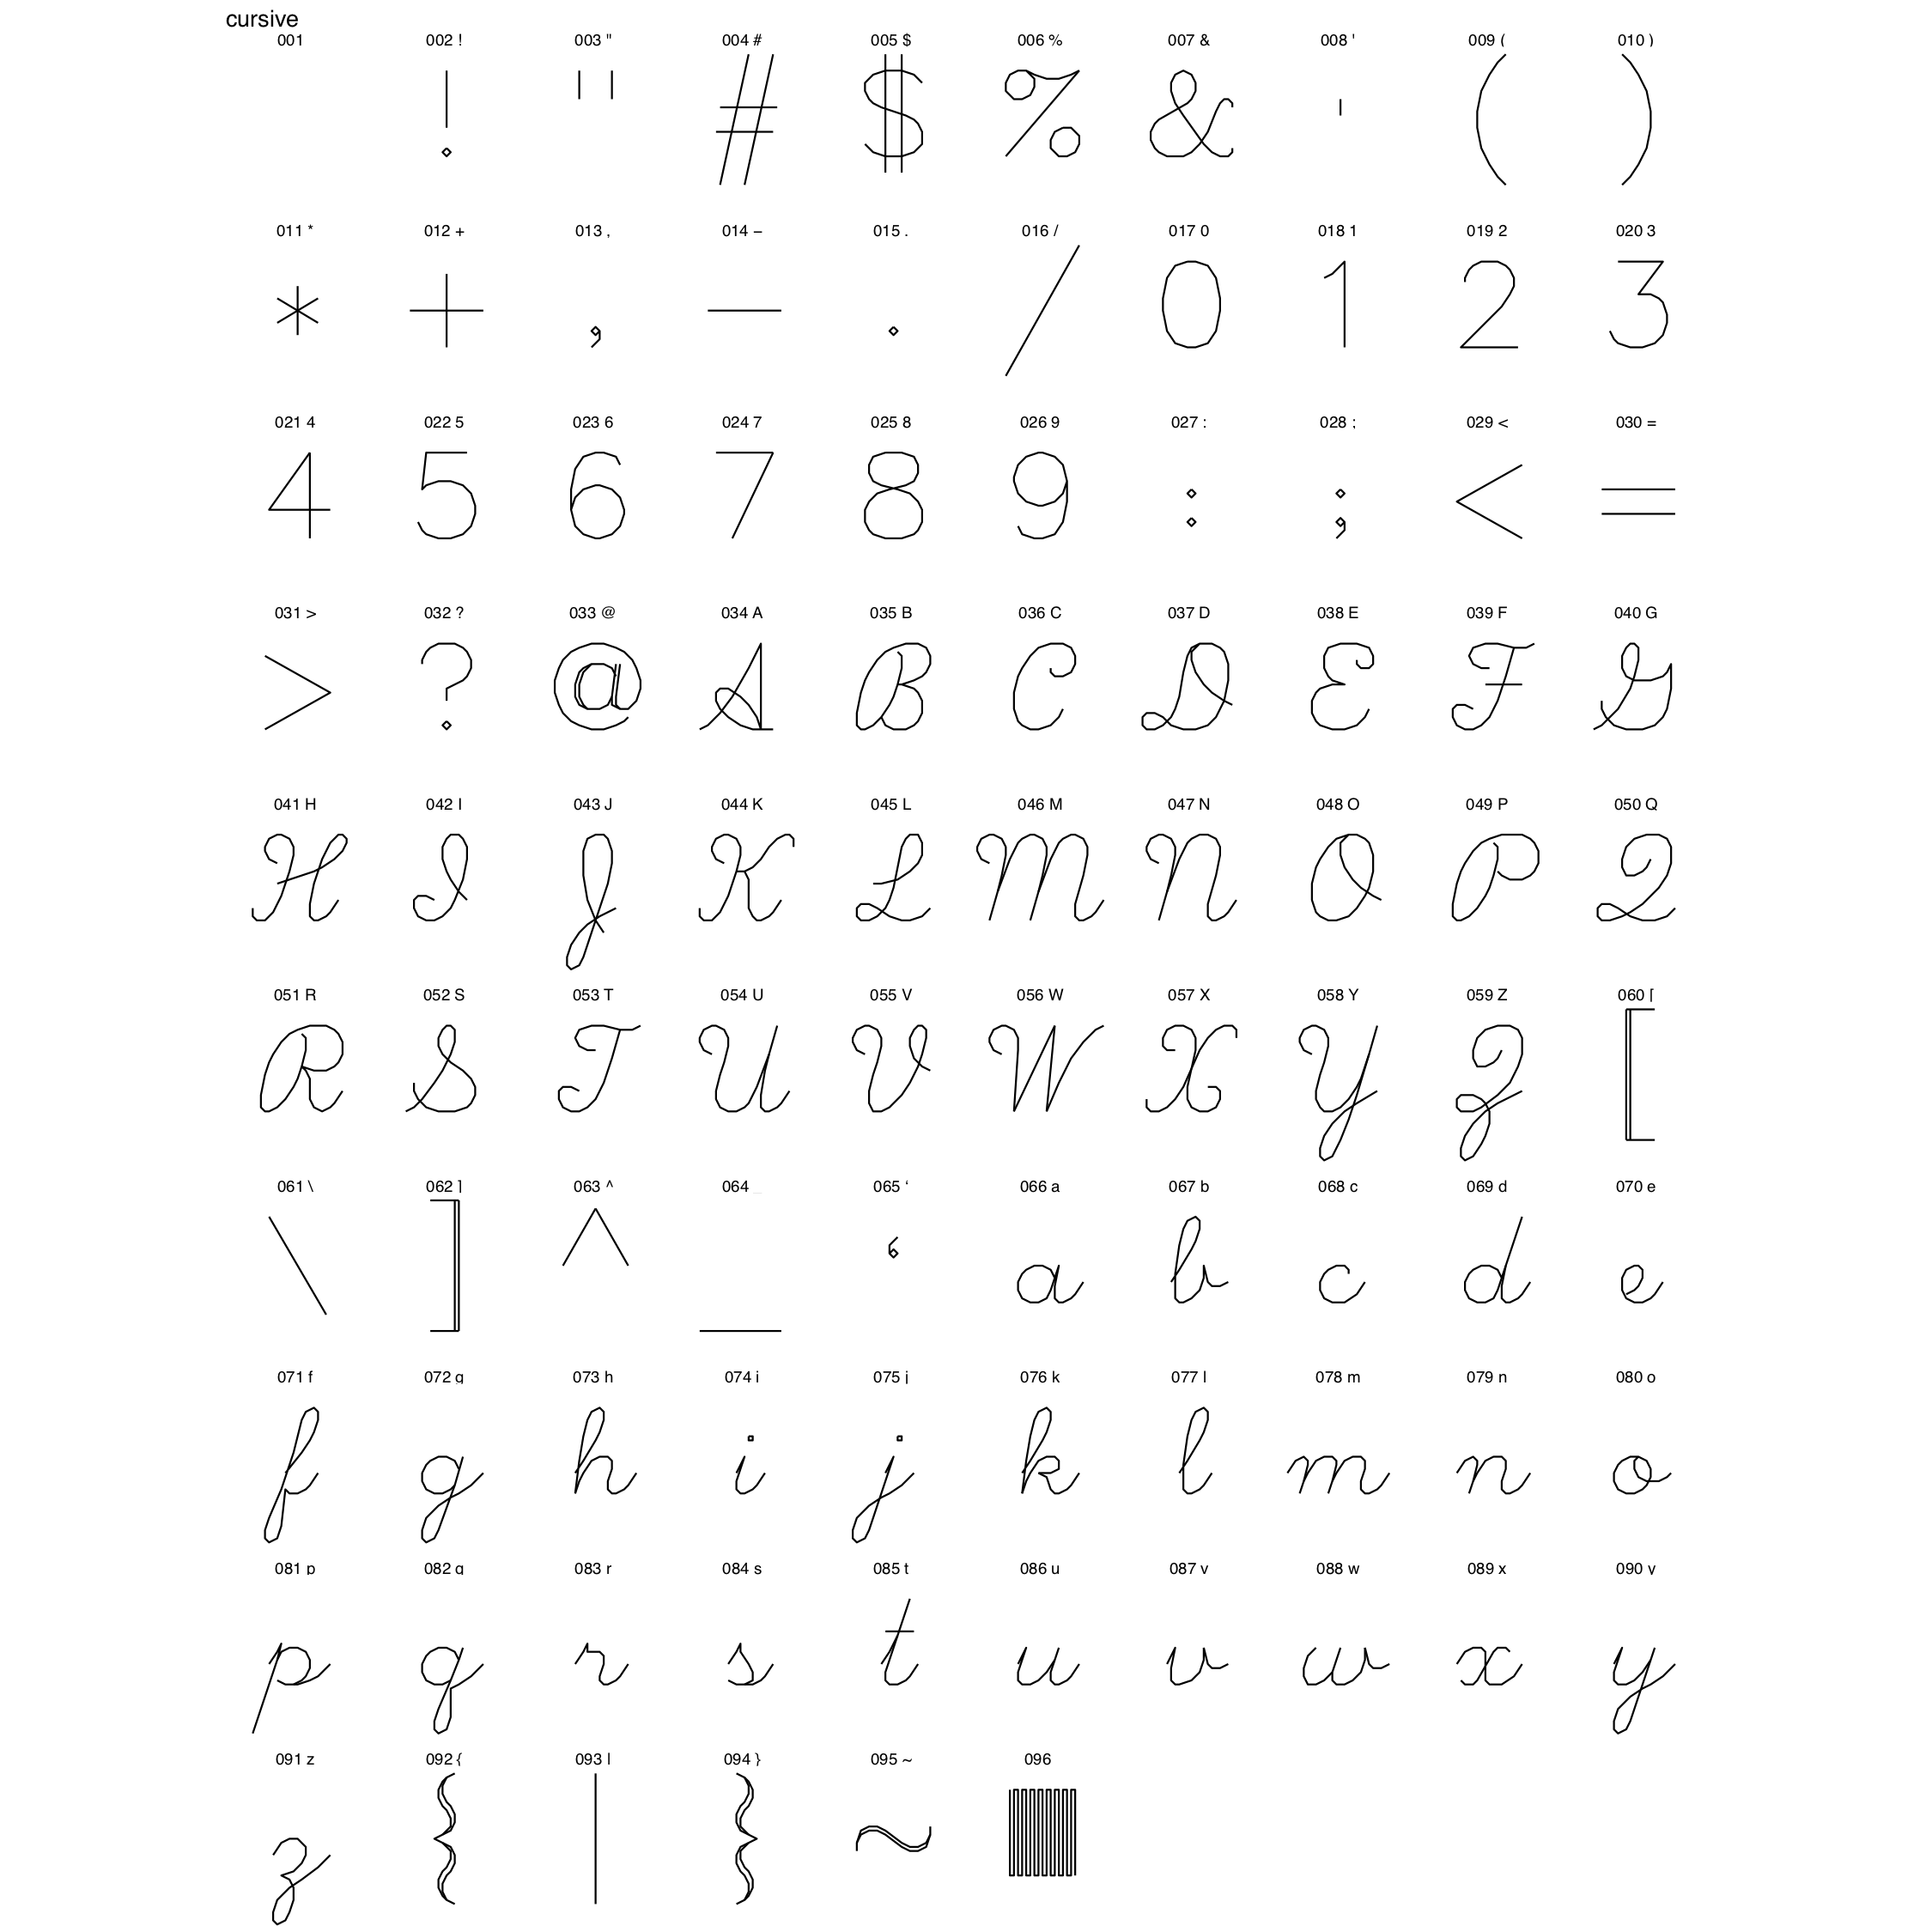
astrology | cursive | cursive | cyrilc_1 | cyrillic | futural | futuram | gothgbt | gothgrt | gothiceng | gothicger | gothicita | gothitt | greek | greekc | greeks | japanese | japanese2 | markers | mathlow | mathupp | meteorology | music | rowmand | rowmans | rowmant | scriptc | scripts | symbolic | timesg | timesi | timesib | timesr | timesrb
Example: All the ’A’s
glyph_df <- hershey %>%
  filter(char == 'A')

ggplot(glyph_df) +
  geom_path(aes(x, y, group = stroke)) +
  coord_equal() +
  theme_void() +
  facet_wrap(~font)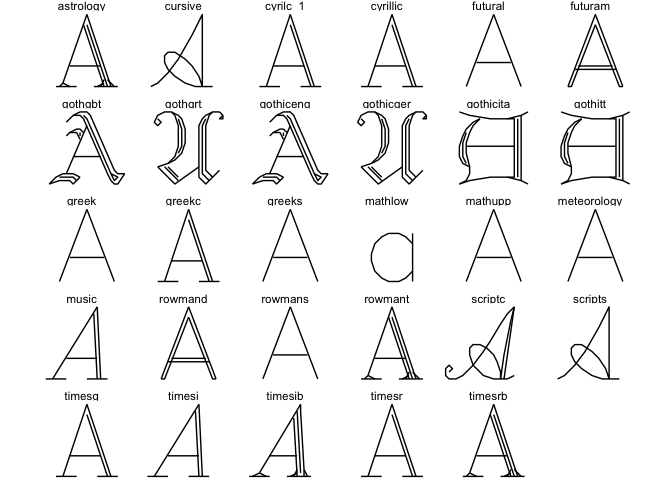
Example: Futura!
glyph_df <- hershey %>%
  filter(font == 'futuram', glyph %in% c(32:46))

ggplot(glyph_df) +
  geom_path(aes(x, y, group = stroke)) +
  coord_equal() +
  theme_void() +
  facet_wrap(~glyph, labeller = label_both, ncol = 5)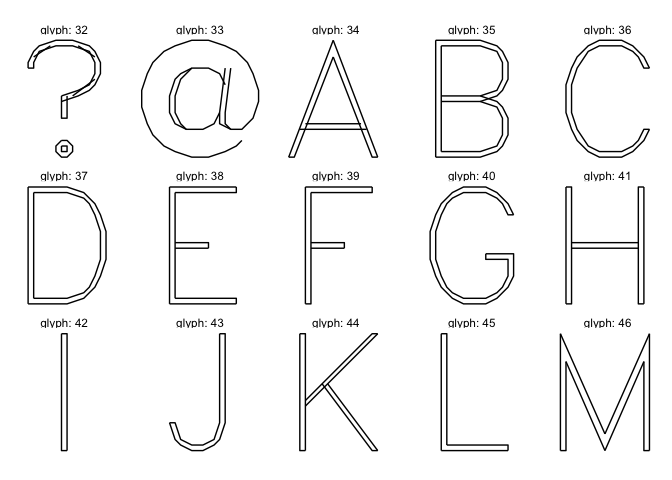
Example: Render text string
The function create_string_df() will create a data.frame of all the characters in the given string. It will offset each character by the known widths of the preceding characters to create a well-spaced set of points.
string_df <- hershey::create_string_df(text = "#RStats", font = 'cursive')

ggplot(string_df, aes(x, y, group = interaction(char_idx, stroke))) +
  geom_path() +
  geom_point(size = 1) +
  coord_equal() +
  theme_void()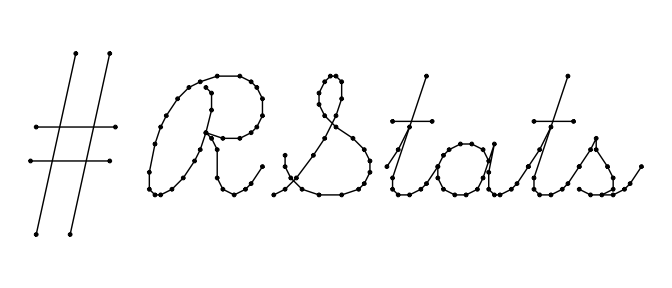
References
- Wikipedia
- A great presentation about Hershey and the era of the font
- Paul Burke’s description of the format
- A more modern vector font by inconvergent: gridfont
Use Restrictions on Hershey Fonts
Totally free (except if you convert them to the proprietary US NTIS format)
The following use restriction was noted in the original font distribution.
    USE RESTRICTION:
    This distribution of the Hershey Fonts may be used by anyone for
    any purpose, commercial or otherwise, providing that:
        1. The following acknowledgements must be distributed with
            the font data:
            - The Hershey Fonts were originally created by Dr.
                A. V. Hershey while working at the U. S.
                National Bureau of Standards.
            - The format of the Font data in this distribution
                was originally created by
                    James Hurt
                    Cognition, Inc.
                    900 Technology Park Drive
                    Billerica, MA 01821
                    (mit-eddie!ci-dandelion!hurt)
        2. The font data in this distribution may be converted into
            any other format *EXCEPT* the format distributed by
            the U.S. NTIS (which organization holds the rights
            to the distribution and use of the font data in that
            particular format). Not that anybody would really
            *want* to use their format... each point is described
            in eight bytes as "xxx yyy:", where xxx and yyy are
            the coordinate values as ASCII numbers.


