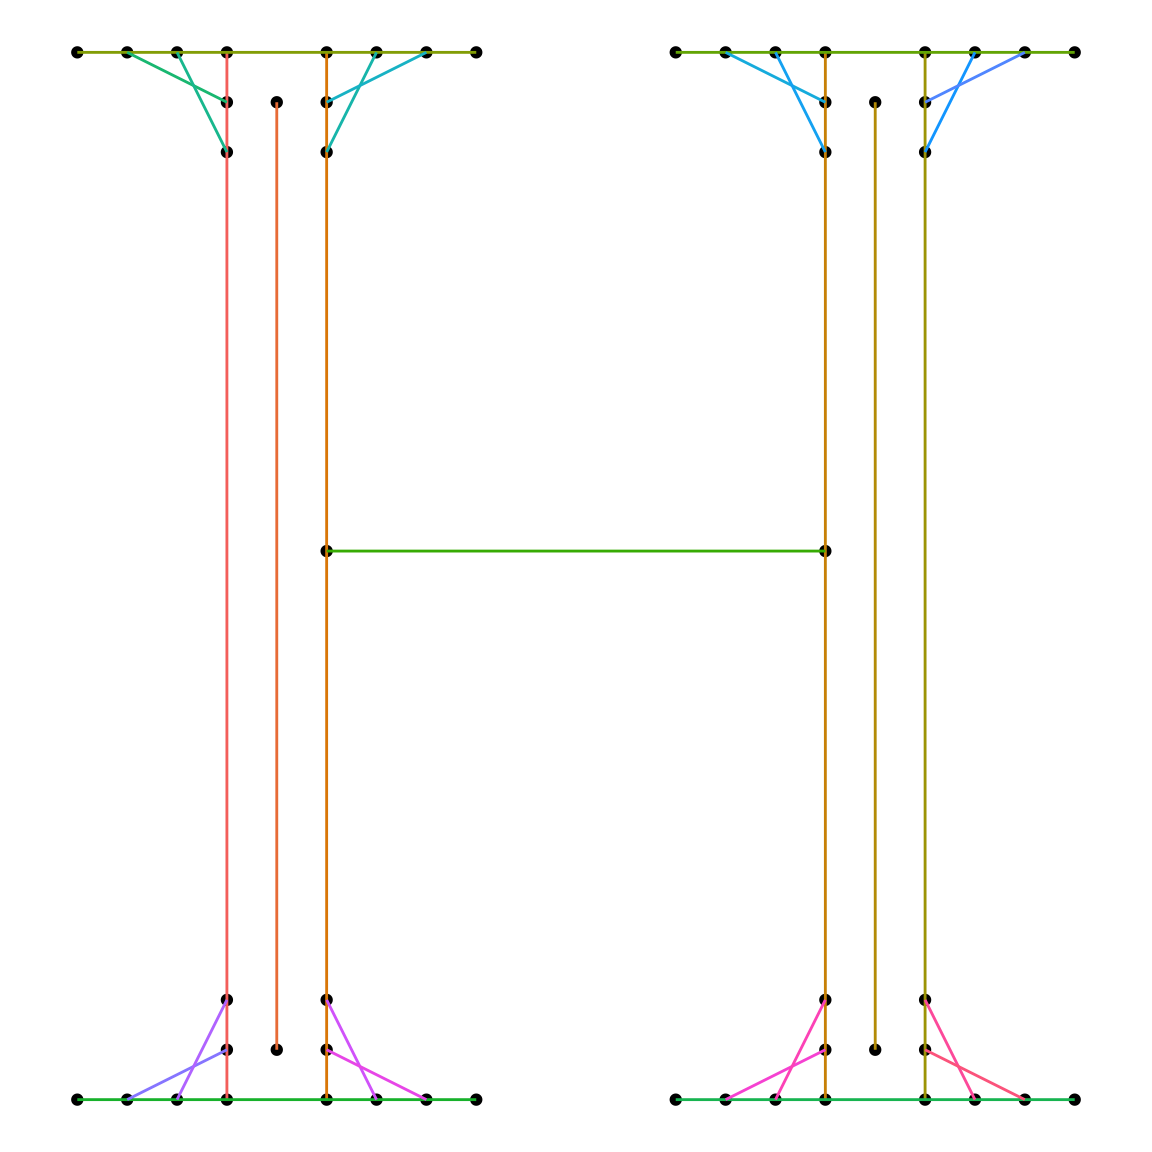
Visualse glyph stroke order
visualise-stroke-order.Rmd## Example: Visualise stroke order
glyph_df <- hershey %>%
filter(font == 'rowmant', char == 'H')
ggplot(glyph_df) +
geom_point(aes(x, y)) +
geom_path(aes(x, y, group = stroke, colour = stroke)) +
coord_equal() +
theme_void() +
theme(legend.position = 'none')