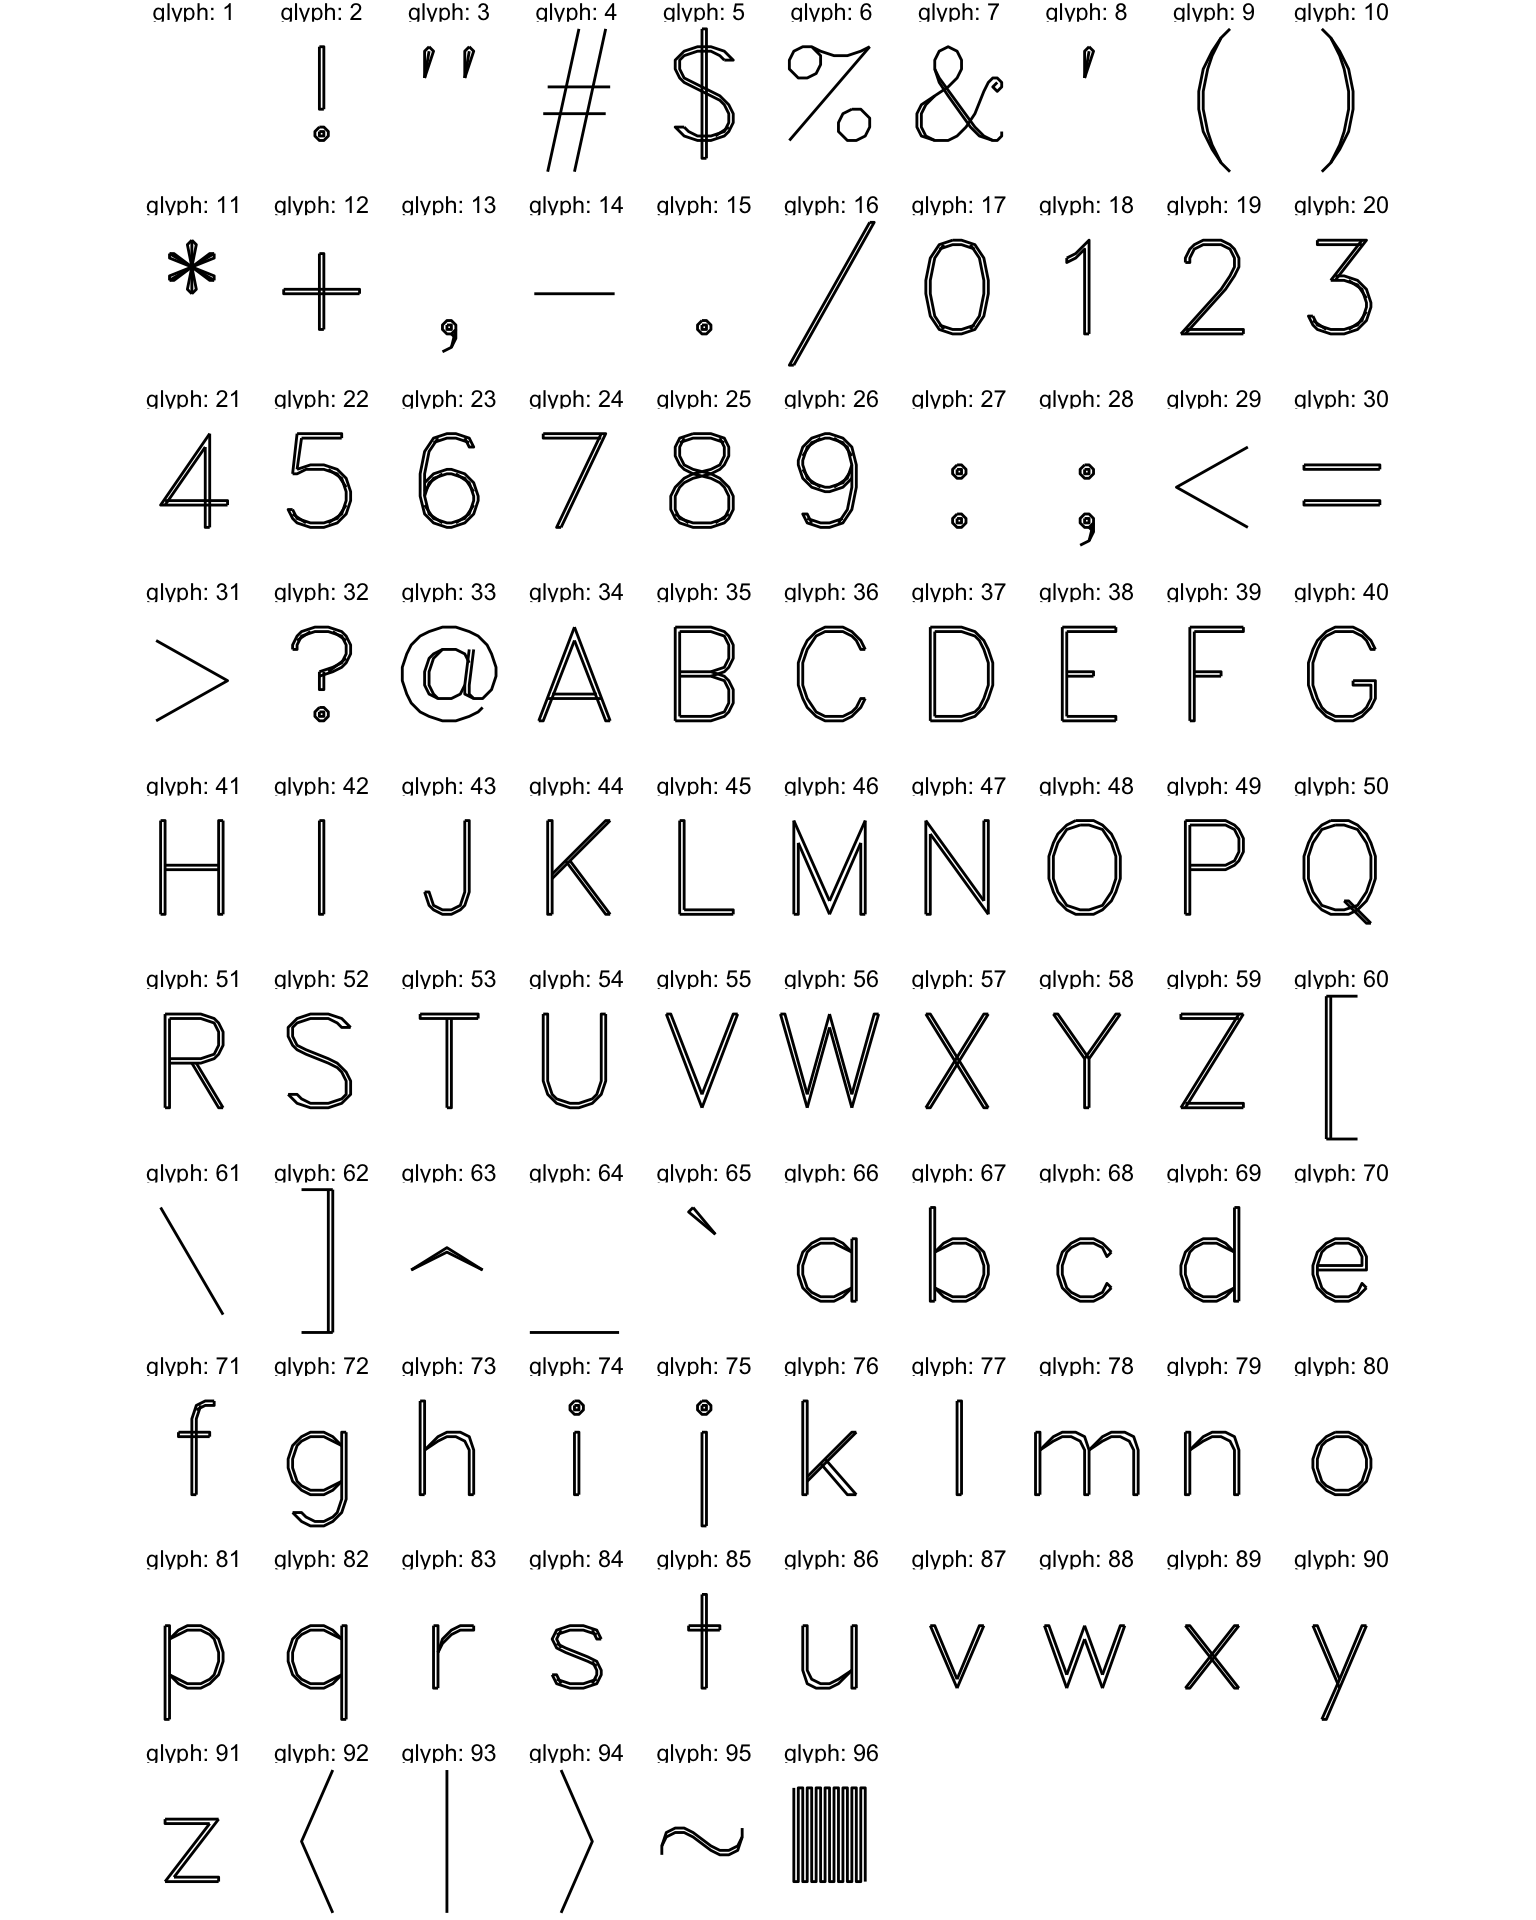
Generate a sample sheet for a font
generate-sample-sheet.Rmd#> # A tibble: 6 x 11
#> x y left right width stroke idx glyph font ascii char
#> <int> <int> <int> <int> <int> <fct> <int> <int> <chr> <int> <chr>
#> 1 0 0 -8 8 16 0 1 1 futuram 32 " "
#> 2 0 12 -5 6 11 0 1 2 futuram 33 !
#> 3 0 -2 -5 6 11 0 2 2 futuram 33 !
#> 4 1 -2 -5 6 11 0 3 2 futuram 33 !
#> 5 0 12 -5 6 11 1 4 2 futuram 33 !
#> 6 1 12 -5 6 11 1 5 2 futuram 33 !ggplot(font_df) +
geom_path(aes(x, y, group = stroke)) +
coord_equal() +
theme_void() +
facet_wrap(~glyph, labeller = label_both)#> geom_path: Each group consists of only one observation. Do you need to
#> adjust the group aesthetic?