library(dplyr)##
## Attaching package: 'dplyr'## The following objects are masked from 'package:stats':
##
## filter, lag## The following objects are masked from 'package:base':
##
## intersect, setdiff, setequal, union## Loading required package: devoutA static heart plot in ggplot
plot_df <- tibble(
  t  = seq(-pi, 0, 0.001),
  x1 = 16 * sin(t) ^ 2,
  x2 = -x1,
  y  = 13 * cos(t) - 5 * cos(2 * t) - 2 * cos(3 * t) - cos(4*t)
) %>%
  gather(side, x, x1, x2)


p <- ggplot(plot_df, aes(x, y)) +
  geom_polygon(fill = 'red') +
  coord_fixed() +
  theme_minimal()

p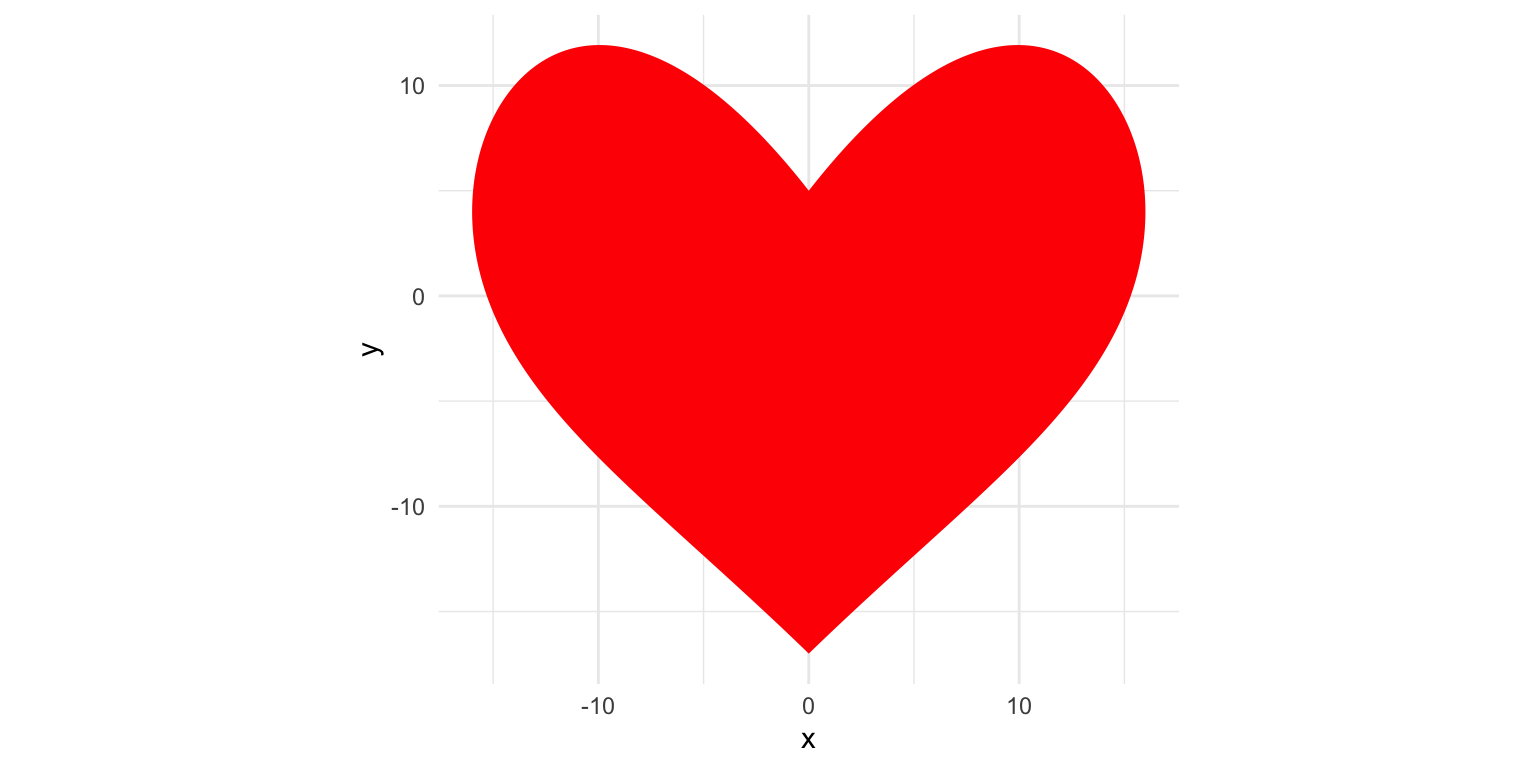
Add CSS styling to the SVG output
The CSS below defines 3 frames of animation (@keyframes) which take place of 2 seconds and apply to the ID of the first polygon in the scene: #polygon-0001.
The CSS is added to the output when calling the device i.e. devoutsvg::svgout(..., css_decl = my_css, ...)
my_css_decl <- "
@keyframes pulse {
  from {transform: scale3d(1, 1, 1);}
  50%  {transform: scale3d(1.15, 1.15, 1.15);}
  to   {transform: scale3d(1, 1, 1);}
}

#polygon-0001 {
  animation-name: pulse;
  animation-duration: 2s;
  animation-fill-mode: both;
  animation-iteration-count: infinite;
}
}
"

svgfile <- tempfile(fileext = '.svg')
devoutsvg::svgout(filename = svgfile, width = 8, height = 4,
       css_decl = my_css_decl)

  p +
    labs(title = "Beating heart with {devoutsvg}",
         subtitle = "SVG graphics output with added CSS styling")

invisible(dev.off())