![]()
![]()
![]()
devoutsvg provides a bespoke SVG graphics device written in plain R.
Because github sanitises SVG to remove some elements of style, scripting and animation, please see the devoutsvg pkgdown website to view the animations.
Key Features
- Behaves like a normal graphic output device
- Written in plain R (making use of devout for the interface to C)
- Can use pattern fills for area - either using raw SVG,
minisvgdocuments or packages such as:-
svgpatternsimplefor simple repeating stripes and dots etc -
svgpatternusgsfor geological patterns from the USGS
-
- Can include Javascript to further customise the output.
What’s New
- Complete refactor of how pattern fills are specified. This used to be via packages which provided patterns, but is now done directly in a
pattern_listobject supplied by the user when thesvgoutdevice is called.
Future
- Work out a convenient way to specify CSS, Javascript and SVG on individual elements within the plot.
Warning
This package is still very experimental. The means of specifying CSS, javascript, patterns and filters will evolve.
Installation
You can install from GitHub with:
# install.packages("devtools")
devtools::install_github("coolbutuseless/minisvg")   # SVG creation
devtools::install_github("coolbutuseless/devout")    # Device interface
devtools::install_github("coolbutuseless/devoutsvg") # This package
Using the svgout device
Use this device in the same way you would use pdf(), png() any of the other graphics output devices in R.
#~~~~~~~~~~~~~~~~~~~~~~~~~~~~~~~~~~~~~~~~~~~~~~~~~~~~~~~~~~~~~~~~~~~~~~~~~~~~~~
# Create a very boring plot
#~~~~~~~~~~~~~~~~~~~~~~~~~~~~~~~~~~~~~~~~~~~~~~~~~~~~~~~~~~~~~~~~~~~~~~~~~~~~~~
example_plot <- ggplot(mtcars) +
  geom_density(aes(mpg, fill = as.factor(cyl))) +
  labs(title = "Example `devoutsvg::svgout()` device output") +
  theme_bw() +
  scale_fill_manual(values = c('4' = '#df536b', '6' = '#61d04f', '8' = '#2297e6'))

#~~~~~~~~~~~~~~~~~~~~~~~~~~~~~~~~~~~~~~~~~~~~~~~~~~~~~~~~~~~~~~~~~~~~~~~~~~~~~~
# Output the plot to the `svgout` device
#~~~~~~~~~~~~~~~~~~~~~~~~~~~~~~~~~~~~~~~~~~~~~~~~~~~~~~~~~~~~~~~~~~~~~~~~~~~~~~
devoutsvg::svgout(filename = "man/figures/svgout-example.svg", width = 8, height = 4)
  example_plot
invisible(dev.off())
Filling with patterns
In comparison to standard SVG output devices (such as svg and svglite) this device has options to modify and insert SVG into the output.
The svgout device can be instructed to use patterns instead of the actual RGB colour - this is achieved by
- Defining a pattern through either:
- Providing SVG in a text string
- A
minisvgobject
- Creating a named list associating a hex colour with a pattern
- Passing this named list to the
svgoutdevice.
#~~~~~~~~~~~~~~~~~~~~~~~~~~~~~~~~~~~~~~~~~~~~~~~~~~~~~~~~~~~~~~~~~~~~~~~~~~~~~~
# 1. Define a pattern
#~~~~~~~~~~~~~~~~~~~~~~~~~~~~~~~~~~~~~~~~~~~~~~~~~~~~~~~~~~~~~~~~~~~~~~~~~~~~~~
pattern_gear4 <- svgpatternsimple::create_pattern_stipple(
  id           = 'stipple',
  colour       = '#61d04f',
  spacing      = 10
)

pattern_gear6 <- svgpatternsimple::create_pattern_hex(
  id            = 'hex',
  angle         = 0,
  spacing       = 20,
  fill_fraction = 0.1,
  colour        = '#2297e6'
)
#~~~~~~~~~~~~~~~~~~~~~~~~~~~~~~~~~~~~~~~~~~~~~~~~~~~~~~~~~~~~~~~~~~~~~~~~~~~~~~
# 2. Create a named list associating a hex colour with a pattern to fill with
#~~~~~~~~~~~~~~~~~~~~~~~~~~~~~~~~~~~~~~~~~~~~~~~~~~~~~~~~~~~~~~~~~~~~~~~~~~~~~~
my_pattern_list <- list(
  '#61d04f' = list(fill = pattern_gear4),
  '#2297e6' = list(fill = pattern_gear6)
)

#~~~~~~~~~~~~~~~~~~~~~~~~~~~~~~~~~~~~~~~~~~~~~~~~~~~~~~~~~~~~~~~~~~~~~~~~~~~~~~
# 3. Pass this named `pattern_list` to the `svgout` device
#~~~~~~~~~~~~~~~~~~~~~~~~~~~~~~~~~~~~~~~~~~~~~~~~~~~~~~~~~~~~~~~~~~~~~~~~~~~~~~
svgout(filename = "man/figures/example-manual.svg", width = 8, height = 4,
       pattern_list = my_pattern_list)

  example_plot +
    labs(title = "Example - manual pattern specification")

invisible(dev.off())
Applying an SVG filter to a object
The svgout device can be instructed to apply an SVG filter to a region. Filters can be applied in addition to patterns.
- Defining a pattern/filter through either:
- Providing SVG in a text string
- A
minisvgobject
- Creating a named list associating a hex colour with a pattern
- Passing this named list to the
svgoutdevice.
#~~~~~~~~~~~~~~~~~~~~~~~~~~~~~~~~~~~~~~~~~~~~~~~~~~~~~~~~~~~~~~~~~~~~~~~~~~~~~~
# 1. Define a pattern
#~~~~~~~~~~~~~~~~~~~~~~~~~~~~~~~~~~~~~~~~~~~~~~~~~~~~~~~~~~~~~~~~~~~~~~~~~~~~~~
pattern_gear4 <- svgpatternsimple::create_pattern_gradient(
  id           = 'fire_gradient',
  colour1      = 'red',
  colour2      = 'gold',
  angle        = 90
)

pattern_gear6 <- svgpatternsimple::create_pattern_hex(
  id            = 'hex',
  angle         = 0,
  spacing       = 20,
  fill_fraction = 0.1,
  colour        = '#2297e6'
)

fire_filter <- svgfilter::create_filter_turbulent_displacement(
  id = "fire1"
)
#~~~~~~~~~~~~~~~~~~~~~~~~~~~~~~~~~~~~~~~~~~~~~~~~~~~~~~~~~~~~~~~~~~~~~~~~~~~~~~
# 2. Create a named list associating a hex colour with a pattern to fill with
#~~~~~~~~~~~~~~~~~~~~~~~~~~~~~~~~~~~~~~~~~~~~~~~~~~~~~~~~~~~~~~~~~~~~~~~~~~~~~~
my_pattern_list <- list(
'#61d04f' = list(fill = pattern_gear4, filter = fire_filter),
'#2297e6' = list(fill = pattern_gear6)
)
#~~~~~~~~~~~~~~~~~~~~~~~~~~~~~~~~~~~~~~~~~~~~~~~~~~~~~~~~~~~~~~~~~~~~~~~~~~~~~~
# 3. Pass this named `pattern_list` to the `svgout` device
#~~~~~~~~~~~~~~~~~~~~~~~~~~~~~~~~~~~~~~~~~~~~~~~~~~~~~~~~~~~~~~~~~~~~~~~~~~~~~~
svgout(filename = "man/figures/example-filter.svg", width = 8, height = 4,
pattern_list = my_pattern_list)
example_plot +
labs(title = "Example - patterns + filters")
invisible(dev.off())
Including javascript to customise a plot
The following example includes the D3 javascript library and includes javascript code to manipulate the plot. You don’t have to include any javascript libraries if you don’t want - and you can just write raw javascript to manipulate the DOM.
Note: because github removes js/css from SVG objects a screenshot of the resulting SVG is included.
my_js_code <- "
d3.select('#polygon-0001').style('fill', null);
d3.select('#polygon-0003').style('stroke-width', 10);
"

svgout(filename = "man/figures/example-javascript.svg", width = 8, height = 4,
       js_url = "https://d3js.org/d3.v5.min.js", js_code = my_js_code)

  example_plot +
    labs(title = "Example - javascript (D3)")

invisible(dev.off())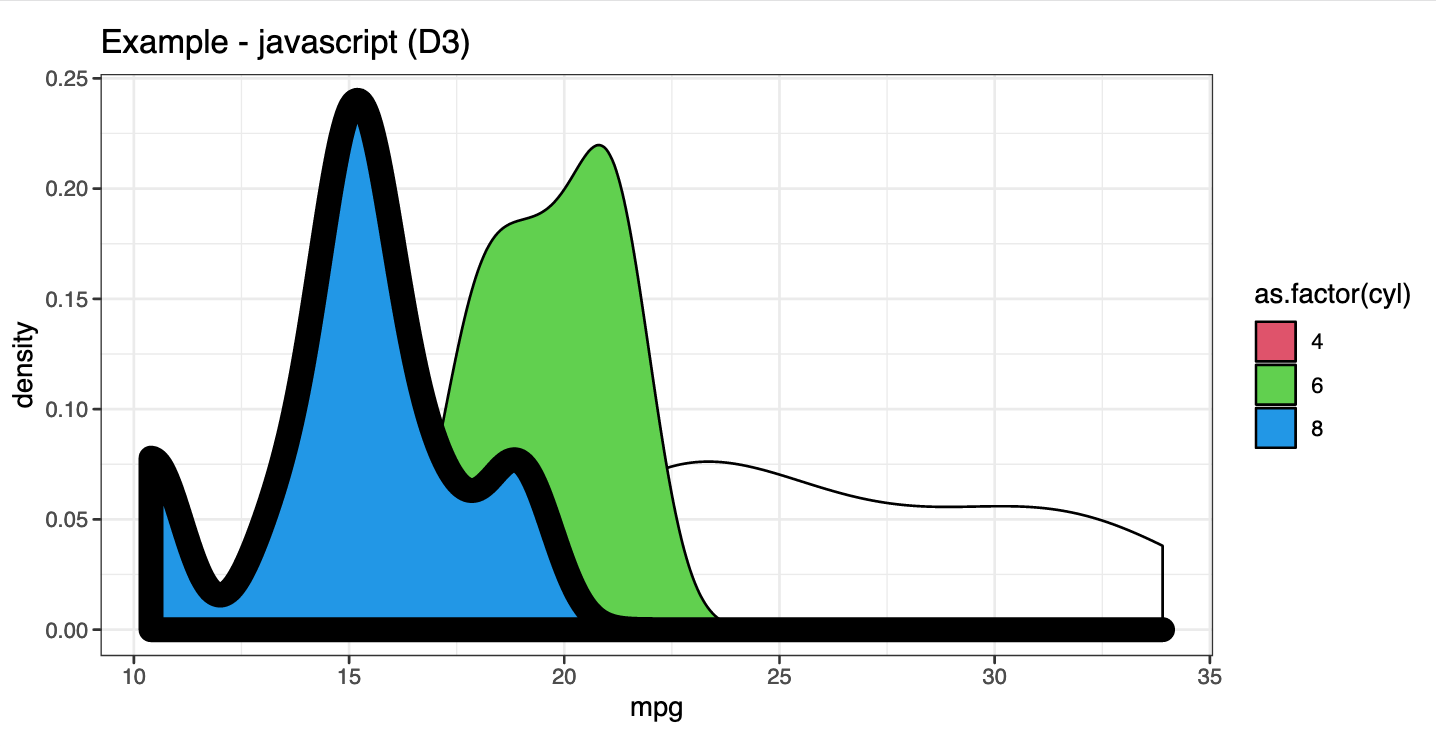
Including CSS to customise a plot
The following example includes the animate.css CSS library and includes CSS declarations to apply these styles to some objects.
You don’t have to include any CSS libraries if you don’t want - and you can just write raw CSS to style the DOM.
Note: because github removes js/css from SVG objects a screenshot of the resulting SVG is included.
my_css_decl <- "
@keyframes pulse {
  from {transform: scale3d(1, 1, 1);}
  50%  {transform: scale3d(1.15, 1.15, 1.15);}
  to   {transform: scale3d(1, 1, 1);}
}

#polygon-0003 {
  animation-name: pulse;
  animation-duration: 4s;
  animation-fill-mode: both;
  animation-iteration-count: infinite;
}

rect:hover {
  fill: green !important;
}
"

svgout(filename = "man/figures/example-css.svg", width = 8, height = 4,
       css_decl = my_css_decl)

  example_plot +
    labs(title = "Example - CSS")

invisible(dev.off())
More examples of patterns and filters
Patterns in base plotting
my_pattern_list <- list(
  `#000001` = list(
    fill = svgpatternsimple::create_pattern_stipple(
      id      = 'stipple',
      colour  = '#ff4455',
      spacing = 10
    )),

  `#000002` = list(
    fill = svgpatternsimple::create_pattern_hex(
      id      = 'hex',
      colour  = '#ddff55',
      spacing = 8
    )),

  `#000003` = list(
    fill = svgpatternsimple::create_pattern_check(
      id      = 'check',
      colour  = '#ee55ff',
      spacing = 10
    )
  )
)

colours <- c('tomato', '#000001', '#000002', '#000003')

devoutsvg::svgout(filename = "man/figures/example-pie.svg", width = 4, height = 4,
                  pattern_list = my_pattern_list)
    pie(c(cool = 4, but = 2, use = 1, less = 8), col = colours)
invisible(dev.off())
Geological patterns
library(sf)
library(svgpatternusgs)

#~~~~~~~~~~~~~~~~~~~~~~~~~~~~~~~~~~~~~~~~~~~~~~~~~~~~~~~~~~~~~~~~~~~~~~~~~~~~~
# Select some data
#~~~~~~~~~~~~~~~~~~~~~~~~~~~~~~~~~~~~~~~~~~~~~~~~~~~~~~~~~~~~~~~~~~~~~~~~~~~~~
nc <- sf::st_read(system.file("shape/nc.shp", package = "sf"), quiet = TRUE)
nc$mid <- sf::st_centroid(nc$geometry)
nc <- nc[nc$NAME %in% c('Surry', 'Stokes', 'Rockingham', 'Yadkin', 'Forsyth', 'Guilford'), ]

#~~~~~~~~~~~~~~~~~~~~~~~~~~~~~~~~~~~~~~~~~~~~~~~~~~~~~~~~~~~~~~~~~~~~~~~~~~~~~
# Encode specific USGS pattern numbers into colours
#~~~~~~~~~~~~~~~~~~~~~~~~~~~~~~~~~~~~~~~~~~~~~~~~~~~~~~~~~~~~~~~~~~~~~~~~~~~~~
my_pattern_list <- list(
  `#000001` = list(fill = svgpatternusgs::create_usgs_pattern(usgs_code = 601, spacing = 100, fill='#77ff99')),
  `#000002` = list(fill = svgpatternusgs::create_usgs_pattern(usgs_code = 606, spacing = 100)),
  `#000003` = list(fill = svgpatternusgs::create_usgs_pattern(usgs_code = 629, spacing = 100)),
  `#000004` = list(fill = svgpatternusgs::create_usgs_pattern(usgs_code = 632, spacing = 100)),
  `#000005` = list(fill = svgpatternusgs::create_usgs_pattern(usgs_code = 706, spacing = 100)),
  `#000006` = list(fill = svgpatternusgs::create_usgs_pattern(usgs_code = 717, spacing = 100))
)

devoutsvg::svgout(filename = "man/figures/example-usgs.svg", width = 6, height = 4,
                  pattern_list = my_pattern_list)
ggplot(nc) +
  geom_sf(aes(fill = NAME)) +
  scale_fill_manual(values = names(my_pattern_list)) +
  theme(legend.key.size = unit(0.6, "cm")) +
  labs(title = "U.S. Geological Survey Patterns with `geom_sf()`") +
  theme_bw()
invisible(dev.off())
Retro B&W plotting
my_pattern_list <- list(
  `#000001` = list(fill = svgpatternsimple::create_pattern_stripe(id = 'pattern1', spacing =  5, fill_fraction = 0.7, angle =   0)),
  `#000002` = list(fill = svgpatternsimple::create_pattern_stripe(id = 'pattern2', spacing =  5, fill_fraction = 0.7, angle =  45)),
  `#000003` = list(fill = svgpatternsimple::create_pattern_stripe(id = 'pattern3', spacing =  5, fill_fraction = 0.7, angle = 135)),
  `#000004` = list(fill = svgpatternsimple::create_pattern_hatch (id = 'pattern4', spacing =  7, fill_fraction = 0.2, angle =   0)),
  `#000005` = list(fill = svgpatternsimple::create_pattern_hatch (id = 'pattern5', spacing =  7, fill_fraction = 0.2, angle =  45)),
  `#000006` = list(fill = svgpatternsimple::create_pattern_dot   (id = 'pattern6', spacing =  4, fill_fraction = 0.8, angle =   0)),
  `#000007` = list(fill = svgpatternsimple::create_pattern_dot   (id = 'pattern7', spacing =  8, fill_fraction = 0.7))
)


devoutsvg::svgout(filename = "man/figures/example-retro.svg", width = 6, height = 4,
                  pattern_list = my_pattern_list)
ggplot(mpg) +
  geom_bar(aes(class, fill=class), colour='black') +
  theme_bw() +
  theme(
    panel.grid = element_blank(),
    text       = element_text(size=12,  family="Courier New", face = 'bold'),
    legend.position = 'none'
  ) +
  scale_fill_manual(values = names(my_pattern_list))
invisible(dev.off())
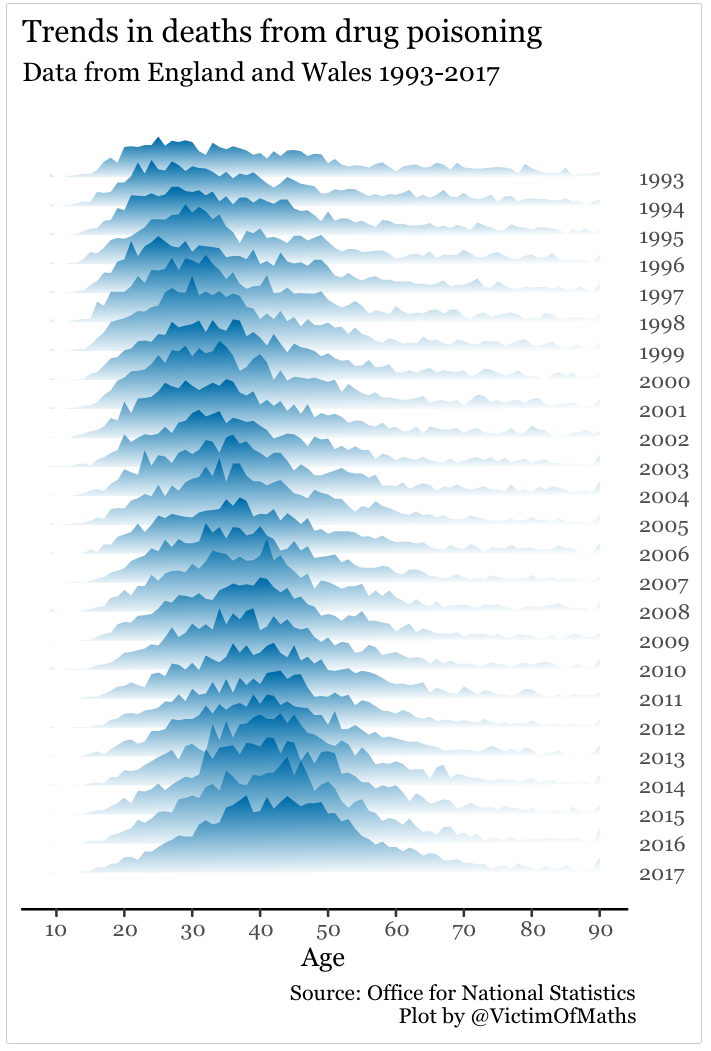
Real-world examples
Left - Death trends
The following was created by VictimOfMaths to compare deaths over time based upon UK ONS data.
The original code is on VictimOfMaths github, and a modified version is included as a vignette (vignette('svg-with-gradient-fill', package = 'devoutsvg')) - see also the online devoutsvg documentation
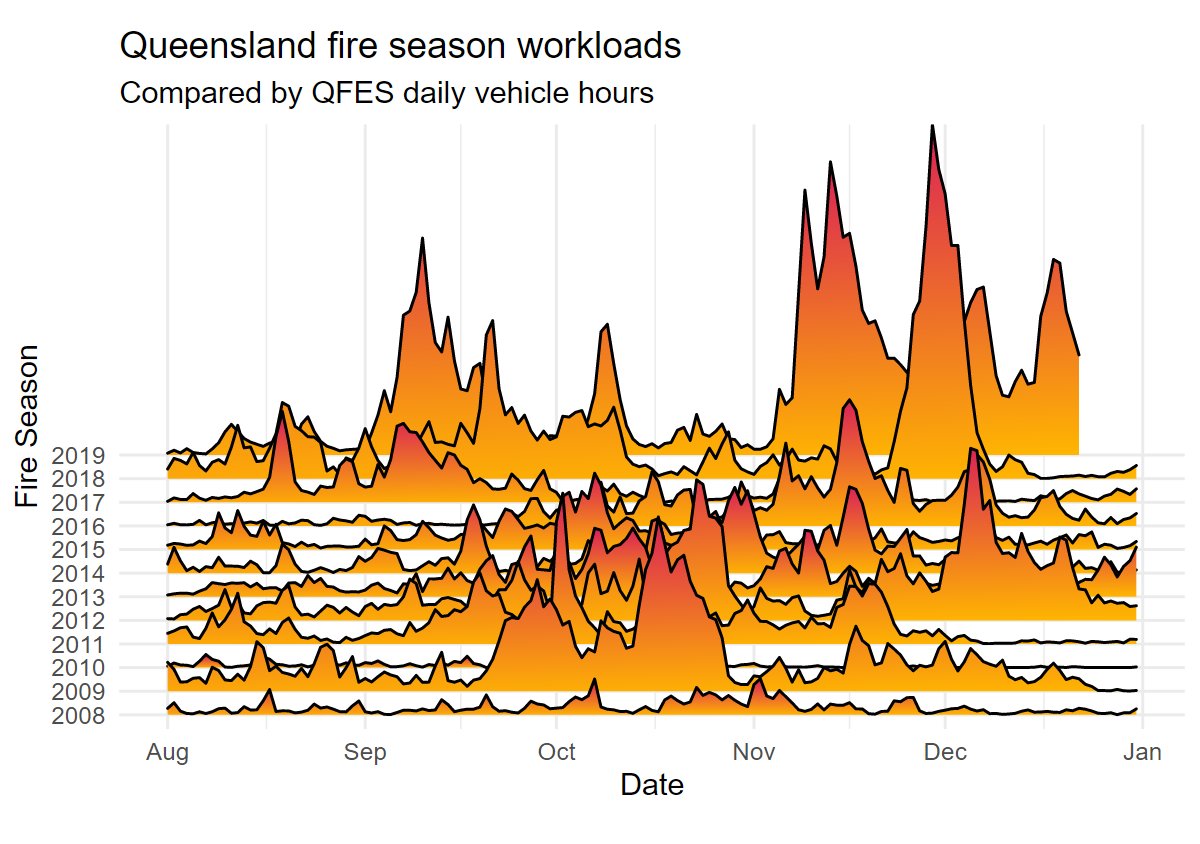
Right - Fire Season Workloads
A similar approach was used by MilesMcbain to create this plot of fire season workloads:
Convert SVG to PDF
If you need a PDF version of an SVG file, there are a number of options.
- Inkscape
-
rsvgon the command linersvg-convert -f pdf -o t.pdf t.svg
-
CairoSVGon the command line (python based)cairosvg in.svg -o out.pdf
-
Imagemagick(not 100% sure)convert file.svg file.pdf
-
Chromeheadless (maybe?)chrome --headless --disable-gpu --print-to-pdf="output.pdf" "input.svg"
- Web-based. There are lots of these e.g.
Creating the logo for this package
Note: Because github sanitizes SVG files it makes the SVG produced in this section unviewable. Instead, the SVG was first saved, and then rendered to PNG
library(minisvg)
#~~~~~~~~~~~~~~~~~~~~~~~~~~~~~~~~~~~~~~~~~~~~~~~~~~~~~~~~~~~~~~~~~~~~~~~~~~~~~
# Building an SVG logo with an animated stripe
#~~~~~~~~~~~~~~~~~~~~~~~~~~~~~~~~~~~~~~~~~~~~~~~~~~~~~~~~~~~~~~~~~~~~~~~~~~~~~
logo <- svg_doc(width = 200, height = 200)$
  update(width=NULL, height=NULL)

#~~~~~~~~~~~~~~~~~~~~~~~~~~~~~~~~~~~~~~~~~~~~~~~~~~~~~~~~~~~~~~~~~~~~~~~~~~~~~
# Background White Rect
#~~~~~~~~~~~~~~~~~~~~~~~~~~~~~~~~~~~~~~~~~~~~~~~~~~~~~~~~~~~~~~~~~~~~~~~~~~~~~
logo$rect(x=0, y=0, width="100%", height="100%", fill='white')


#~~~~~~~~~~~~~~~~~~~~~~~~~~~~~~~~~~~~~~~~~~~~~~~~~~~~~~~~~~~~~~~~~~~~~~~~~~~~~
# Create a hexagon filled, and add it to the document
#~~~~~~~~~~~~~~~~~~~~~~~~~~~~~~~~~~~~~~~~~~~~~~~~~~~~~~~~~~~~~~~~~~~~~~~~~~~~~
len     <- 95
angles  <- (seq(0, 360, 60) + 90) * pi/180
xs      <- round(len * cos(angles) + 100, 2)
ys      <- round(len * sin(angles) + 100, 2)
hex     <- stag$polygon(id = 'hex', xs = xs, ys = ys)
hex$update(stroke = '#223344', fill_opacity=0, stroke_width = 3)
logo$append(hex)


#~~~~~~~~~~~~~~~~~~~~~~~~~~~~~~~~~~~~~~~~~~~~~~~~~~~~~~~~~~~~~~~~~~~~~~~~~~~~~
# Text label
#~~~~~~~~~~~~~~~~~~~~~~~~~~~~~~~~~~~~~~~~~~~~~~~~~~~~~~~~~~~~~~~~~~~~~~~~~~~~~
text1 <- stag$text(
  "/dev/out/",
  class = "mainfont",
  x = 22, y = 90
)

text2 <- stag$text(
  "svg",
  class = "mainfont",
  x = 72, y = 135
)

logo$append(text1)
logo$append(text2)


#~~~~~~~~~~~~~~~~~~~~~~~~~~~~~~~~~~~~~~~~~~~~~~~~~~~~~~~~~~~~~~~~~~~~~~~~~~~~~
# Load CSS for google font and specify styling for 'mainfont'
#~~~~~~~~~~~~~~~~~~~~~~~~~~~~~~~~~~~~~~~~~~~~~~~~~~~~~~~~~~~~~~~~~~~~~~~~~~~~~
logo$add_css_url("https://fonts.googleapis.com/css?family=Abril%20Fatface")
logo$add_css("
.mainfont {
  font-size: 38px;
  font-family: 'Abril Fatface', sans-serif;
  fill: #223344;
}
")

#~~~~~~~~~~~~~~~~~~~~~~~~~~~~~~~~~~~~~~~~~~~~~~~~~~~~~~~~~~~~~~~~~~~~~~~~~~~~~
# output
#~~~~~~~~~~~~~~~~~~~~~~~~~~~~~~~~~~~~~~~~~~~~~~~~~~~~~~~~~~~~~~~~~~~~~~~~~~~~~
# logo$show()
logo$save("man/figures/logo.svg")
Show/hide SVG text
<?xml version="1.0" encoding="UTF-8"?> <svg viewBox="0 0 200 200" xmlns="http://www.w3.org/2000/svg" xmlns:xlink="http://www.w3.org/1999/xlink"> <style type='text/css'> <![CDATA[ @import url(https://fonts.googleapis.com/css?family=Abril%20Fatface); .mainfont { font-size: 38px; font-family: 'Abril Fatface', sans-serif; fill: #223344; } ]]> </style> <rect fill="white" x="0" y="0" width="100%" height="100%" /> <polygon points="100,195 17.73,147.5 17.73,52.5 100,5 182.27,52.5 182.27,147.5 100,195" id="hex" stroke="#223344" fill-opacity="0" stroke-width="3" /> <text x="22" y="90" class="mainfont"> /dev/out/ </text> <text x="72" y="135" class="mainfont"> svg </text> </svg>
![]()