library(ggplot2)
library(devoutsvg)
#> Loading required package: devout
my_css_decl <- "
@keyframes pulse {
from {transform: scale3d(1, 1, 1);}
50% {transform: scale3d(1.15, 1.15, 1.15);}
to {transform: scale3d(1, 1, 1);}
}
#polygon-0003 {
animation-name: pulse;
animation-duration: 4s;
animation-fill-mode: both;
animation-iteration-count: infinite;
}
rect:hover {
fill: green !important;
}
"
svgfile <- tempfile(fileext = '.svg')
svgout(filename = svgfile, width = 8, height = 4,
css_decl = my_css_decl)
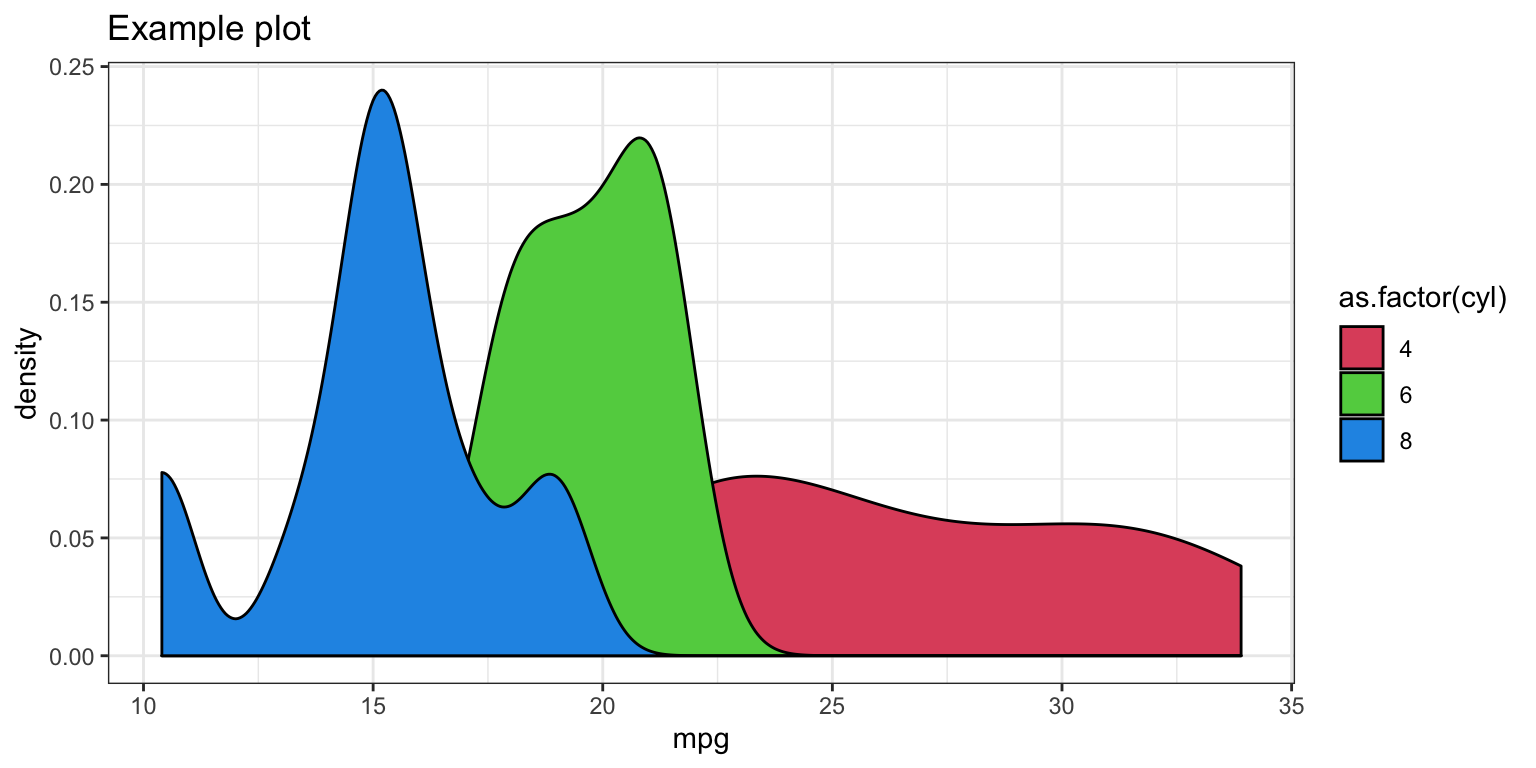
example_plot +
labs(title = "Example - CSS")
invisible(dev.off())