library(devoutsvg)
#> Loading required package: devout
library(ggplot2)
library(minisvg)
#~~~~~~~~~~~~~~~~~~~~~~~~~~~~~~~~~~~~~~~~~~~~~~~~~~~~~~~~~~~~~~~~~~~~~~~~~~~~~
# D3.js code to add a rectangle
#~~~~~~~~~~~~~~~~~~~~~~~~~~~~~~~~~~~~~~~~~~~~~~~~~~~~~~~~~~~~~~~~~~~~~~~~~~~~~
my_js_code <- "
console.log('start {devoutsvg}');
d3.select('svg')
.append('rect')
.attr('x', '25%')
.attr('y', '25%')
.attr('width', '50%')
.attr('height', '50%')
.attr('style', 'fill: blue; fill-opacity: 0.5;')
console.log('end {devoutsvg}');
"
#~~~~~~~~~~~~~~~~~~~~~~~~~~~~~~~~~~~~~~~~~~~~~~~~~~~~~~~~~~~~~~~~~~~~~~~~~~~~~
# Set up the {devoutsvg} graphics device and output a ggplot
#~~~~~~~~~~~~~~~~~~~~~~~~~~~~~~~~~~~~~~~~~~~~~~~~~~~~~~~~~~~~~~~~~~~~~~~~~~~~~
svgfile <- tempfile(fileext = '.svg')
devoutsvg::svgout(
filename = svgfile,
width = 8,
height = 4,
js_url = "https://d3js.org/d3.v5.min.js",
js_code = my_js_code
)
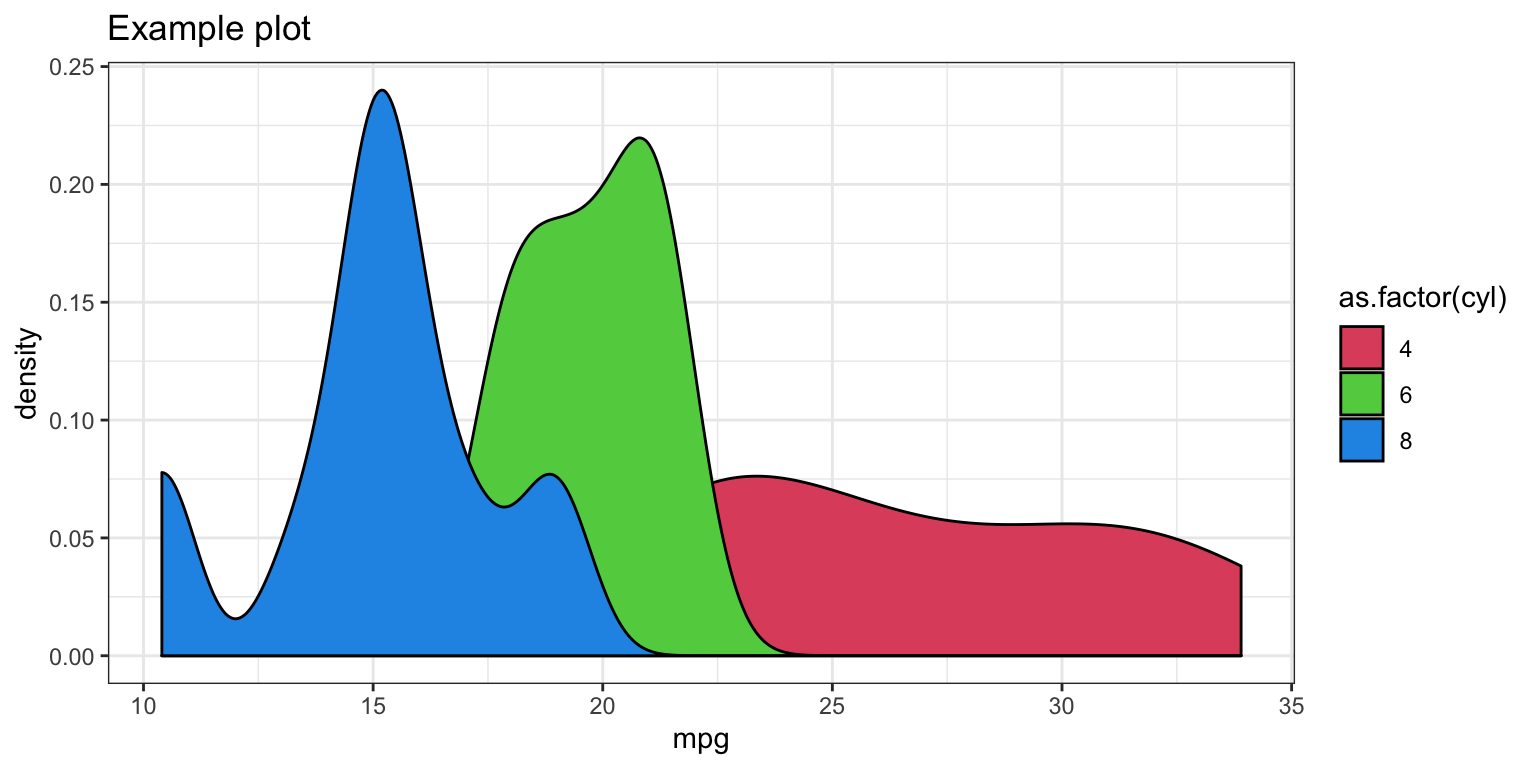
example_plot
invisible(dev.off())