Pattern Crosshatch - Parameters and Examples
Source:vignettes/pattern-crosshatch.Rmd
pattern-crosshatch.RmdPattern Parameters
| aesthetic | description | default | possible values |
|---|---|---|---|
| pattern_colour | Stroke colour | ‘grey20’ | colour |
| pattern_fill | Fill colour of ‘horizontal’ lines | ‘grey80’ | colour |
| pattern_fill2 | Fill colour of ‘vertical’ lines | NA | colour |
| pattern_angle | Rotation angle | 30 | angle in degrees |
| pattern_density | Approx. fraction of area the pattern fills | 0.2 | value in range [0, 1] (fraction) |
| pattern_spacing | Spacing between repetitions of pattern | 0.05 | value in range [0, 1] (snpc units) |
| pattern_xoffset | Shift pattern along x axis | 0 | value in range [0, 1] (snpc units) |
| pattern_yoffset | Shift pattern along y axis | 0 | value in range [0, 1] (snpc units) |
| pattern_alpha | Alpha | NA | value in range [0, 1] or NA |
| pattern_linetype | Stroke linetype | 1 | linetype |
| pattern_size | Stroke linewidth | 1 | linewidth |
There are also a number of parameters for extra control of legend sizing and aspect ratio adjustments. See the ‘Pattern Parameters - Common’ for more information.
Data
Standard data for all the example plots
df <- data.frame(trt = c("a", "b", "c"), outcome = c(2.3, 1.9, 3.2))
df
#>   trt outcome
#> 1   a     2.3
#> 2   b     1.9
#> 3   c     3.2
Vanilla ggplot2
ggplot(df, aes(trt, outcome)) +
  geom_col(aes(fill=trt),colour='black') +
  theme_bw() +
  labs(title = "Plain ggplot2")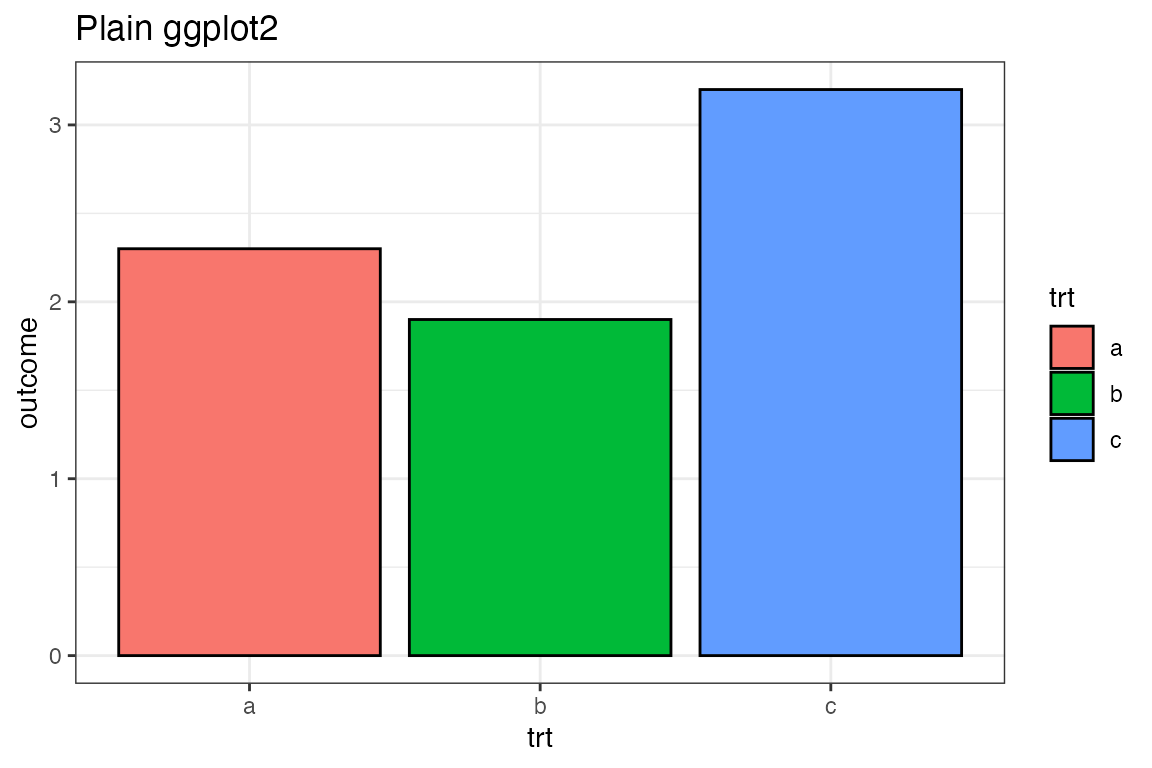
Use the {ggpattern} geom
- Use
ggpattern::geom_col_pattern()instead ofggplot2::geom_col(). - Set
pattern = 'crosshatch'
ggplot(df, aes(trt, outcome)) +
  geom_col_pattern(aes(fill=trt),colour='black', pattern = 'crosshatch') +
  theme_bw() +
  labs(title = "ggpattern")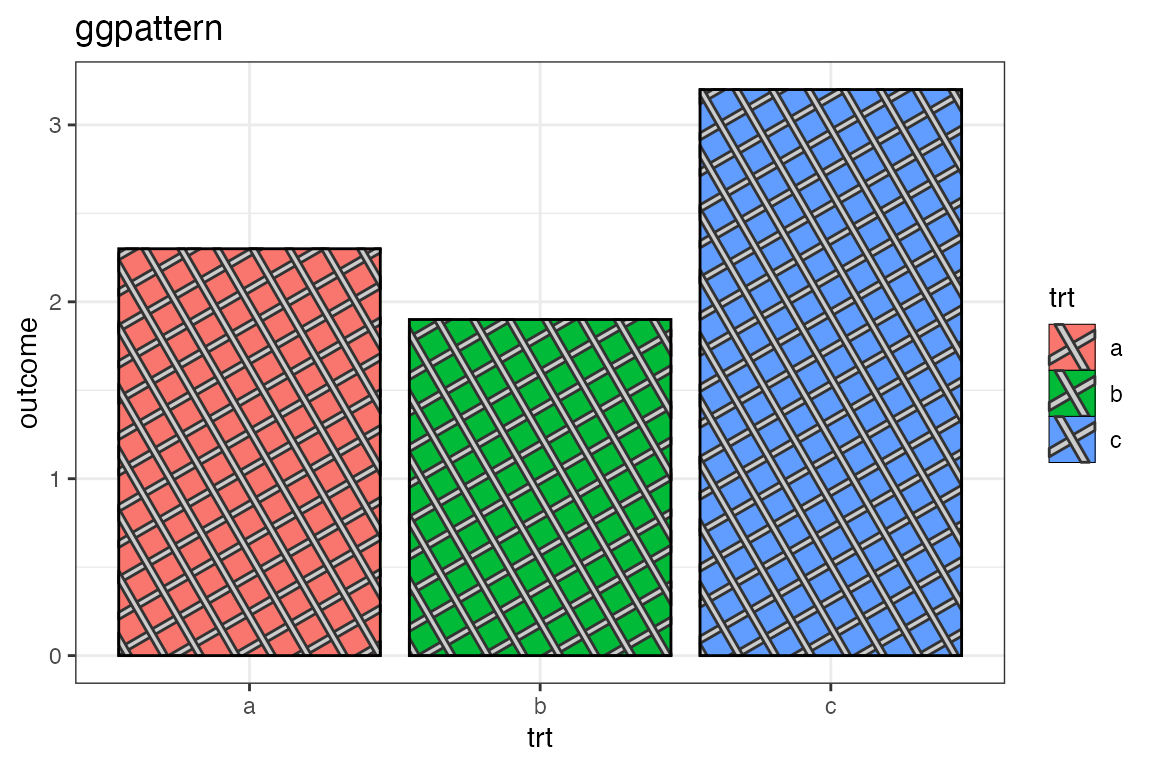
Use coord_fixed()
Due to the underlying nature of grid graphics and how ggplot2 sets up a plot, it is essential to use coord_fixed() in order to achieve consistent looking patterns. Without a fixed coordinate system, then ggpattern has to make guesses on some sizes, and patterns may look askew e.g. 90 degree angles in patterns may no longer appear properly!
ggplot(df, aes(trt, outcome)) +
  geom_col_pattern(aes(fill=trt),colour='black', pattern = 'crosshatch') +
  theme_bw() +
  labs(title = "ggpattern + coord_fixed()") +
  coord_fixed(ratio = 1/2)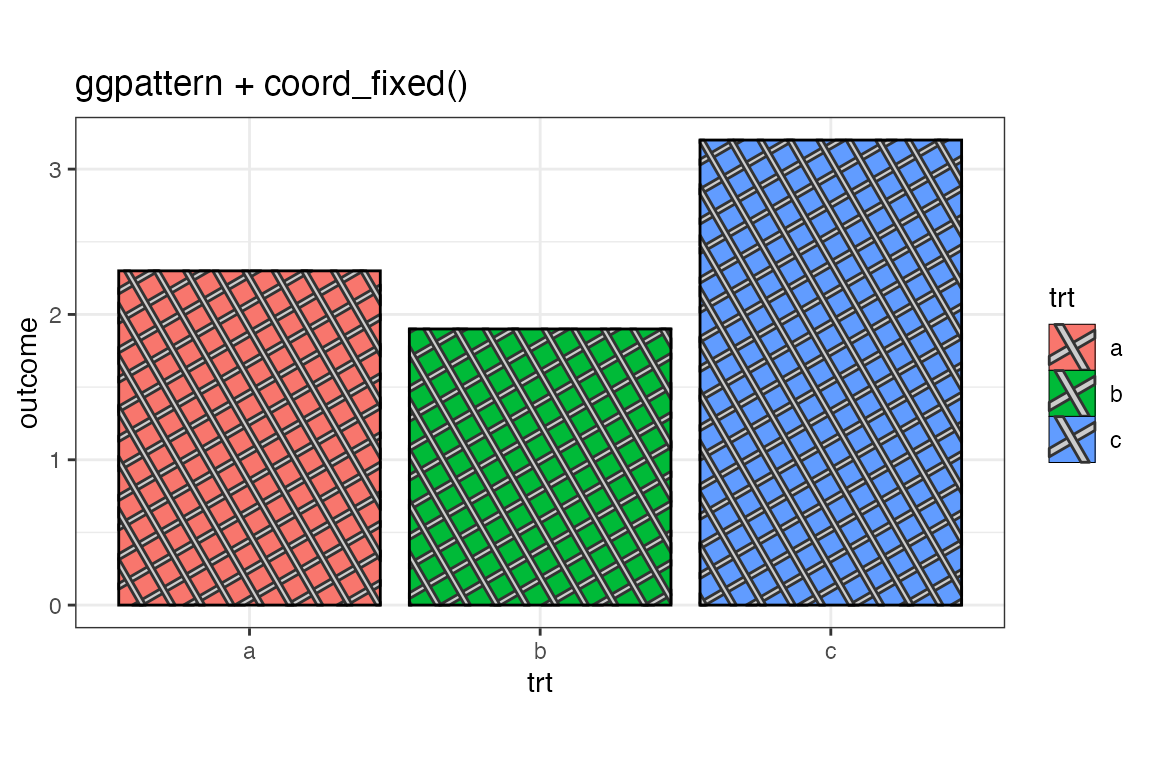
Bigger Legend Keys
Default legends in ggplot2 are usually too small to show off an example of the pattern, so it will usually be necessary to increase the key size.
ggplot(df, aes(trt, outcome)) +
  geom_col_pattern(aes(fill=trt),colour='black', pattern = 'crosshatch') +
  theme_bw() +
  labs(title = "ggpattern + coord_fixed()") +
  coord_fixed(ratio = 1/2) +
  theme(legend.key.size = unit(1.5, 'cm'))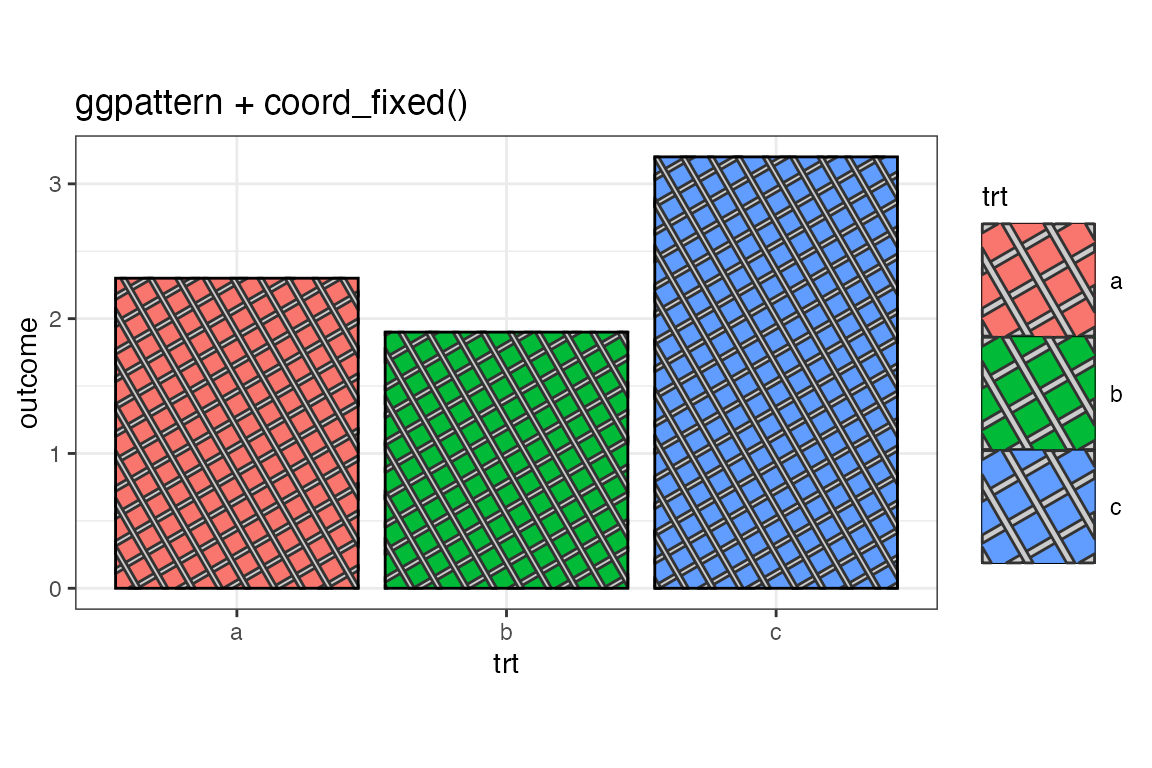
The Density Aesthetic
The aesthetic pattern_density roughly corresponds to the fraction of the filled area which should be covered by the pattern.
In the following plot the density of striping is increased to 50% of the fill area.
ggplot(df, aes(trt, outcome)) +
  geom_col_pattern(
    aes(fill=trt),
    colour          = 'black',
    pattern         = 'crosshatch',
    pattern_density = 0.5
  ) +
  theme_bw() +
  labs(title = "Fixed density of 0.5 (50% of the fill area)") +
  coord_fixed(ratio = 1/2) +
  theme(legend.key.size = unit(1.5, 'cm'))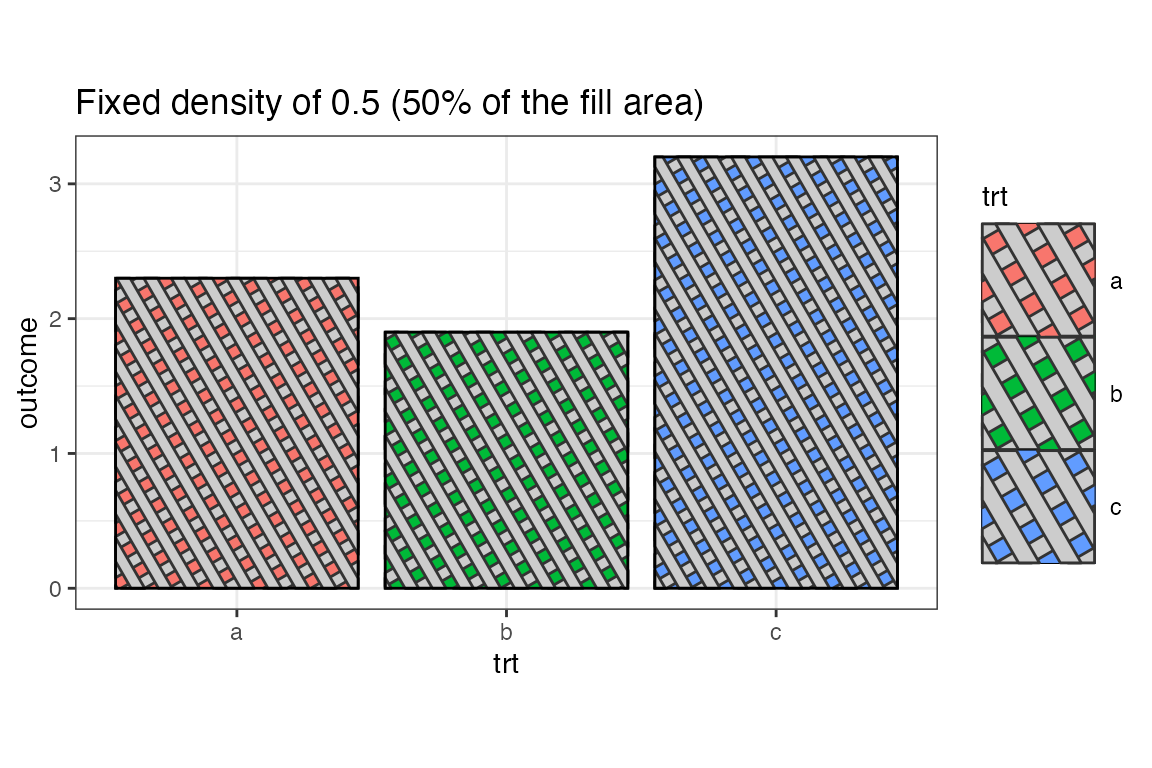
The Density Aesthetic as a Mapped Aesthetic
ggplot(df, aes(trt, outcome)) +
  geom_col_pattern(
    aes(fill = trt, pattern_density = trt),
    colour          = 'black',
    pattern         = 'crosshatch'
  ) +
  theme_bw() +
  labs(title = "Aesthetic Mapping of 'trt' to Density") +
  coord_fixed(ratio = 1/2) +
  theme(legend.key.size = unit(1.5, 'cm'))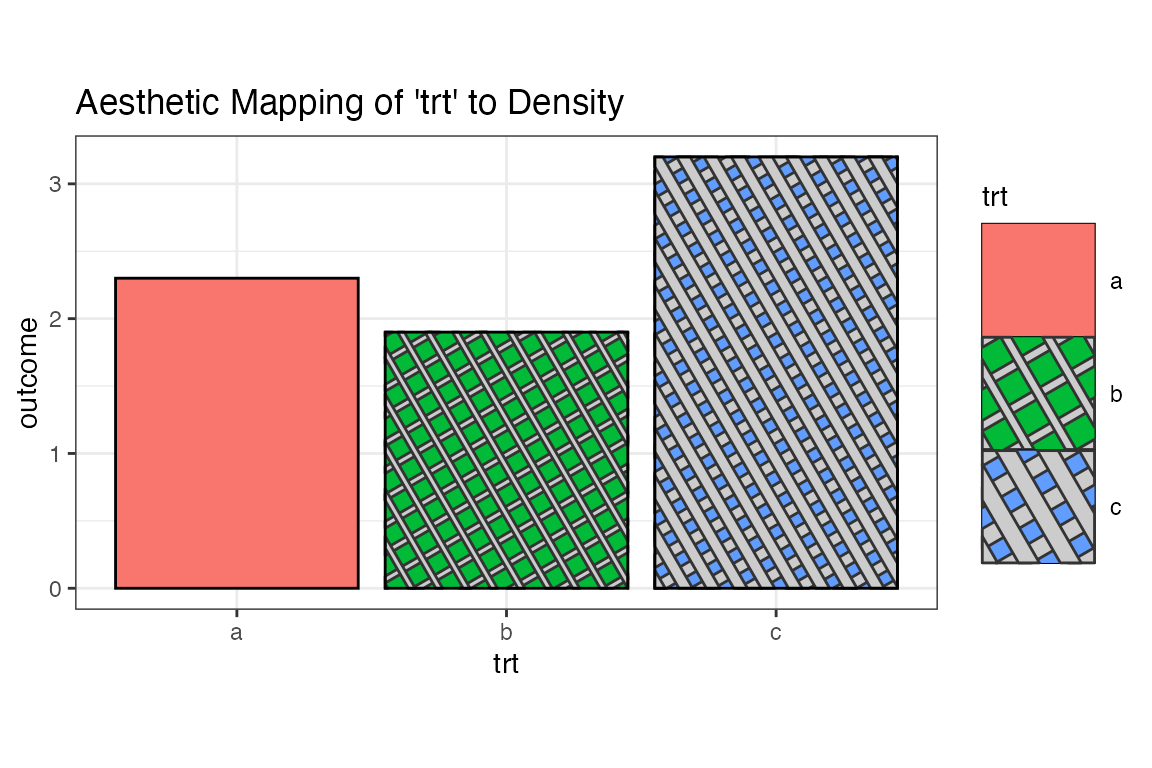
The Density Aesthetic as a Mapped Aesthetic with Manual Scale
scale_pattern_density_manual() can be used to manually control how the variable is mapped to the density.
ggplot(df, aes(trt, outcome)) +
  geom_col_pattern(
    aes(fill = trt, pattern_density = trt),
    colour          = 'black',
    pattern         = 'crosshatch'
  ) +
  theme_bw() +
  labs(title = "Aesthetic Mapping of 'trt' to Density") +
  coord_fixed(ratio = 1/2) +
  theme(legend.key.size = unit(1.5, 'cm')) +
  scale_pattern_density_manual(values = c(a = 0.1, b=0.3, c=0.5))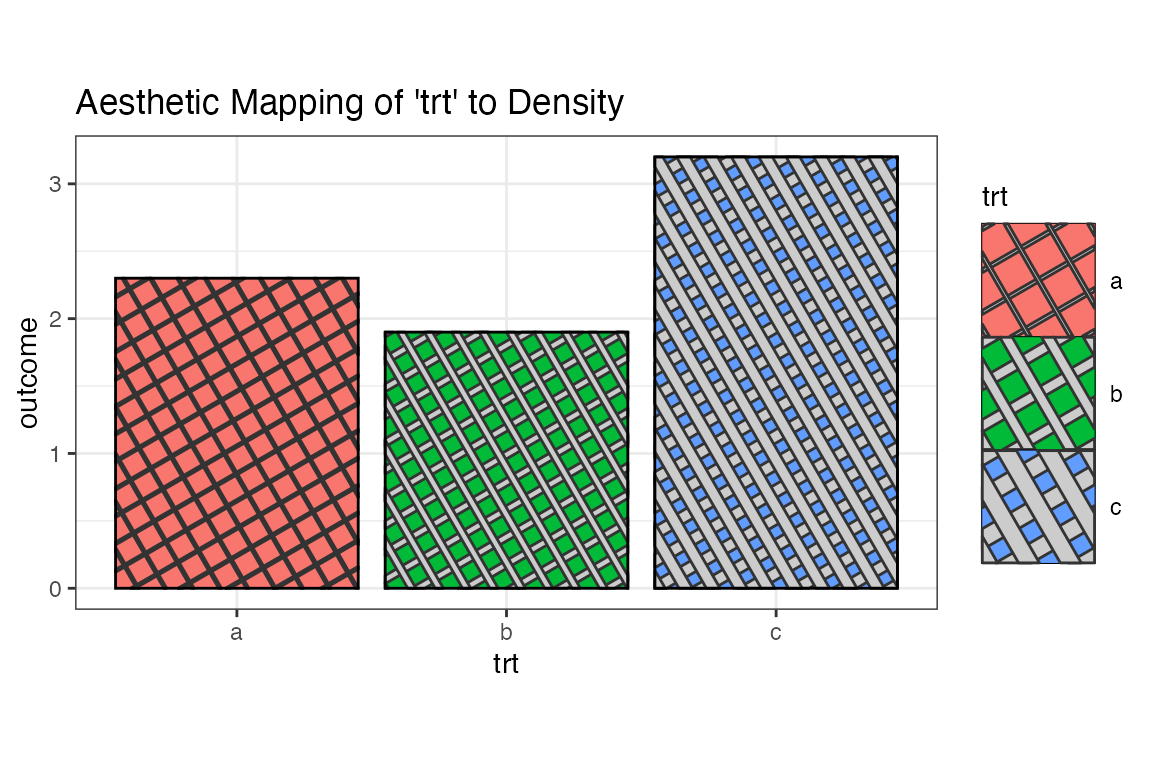
The Spacing Aesthetic as a Mapped Aesthetic
ggplot(df, aes(trt, outcome)) +
  geom_col_pattern(
    aes(fill = trt, pattern_spacing = trt),
    colour          = 'black',
    pattern         = 'crosshatch'
  ) +
  theme_bw() +
  labs(title = "Aesthetic Mapping of 'trt' to Spacing") +
  coord_fixed(ratio = 1/2) +
  theme(legend.key.size = unit(1.5, 'cm'))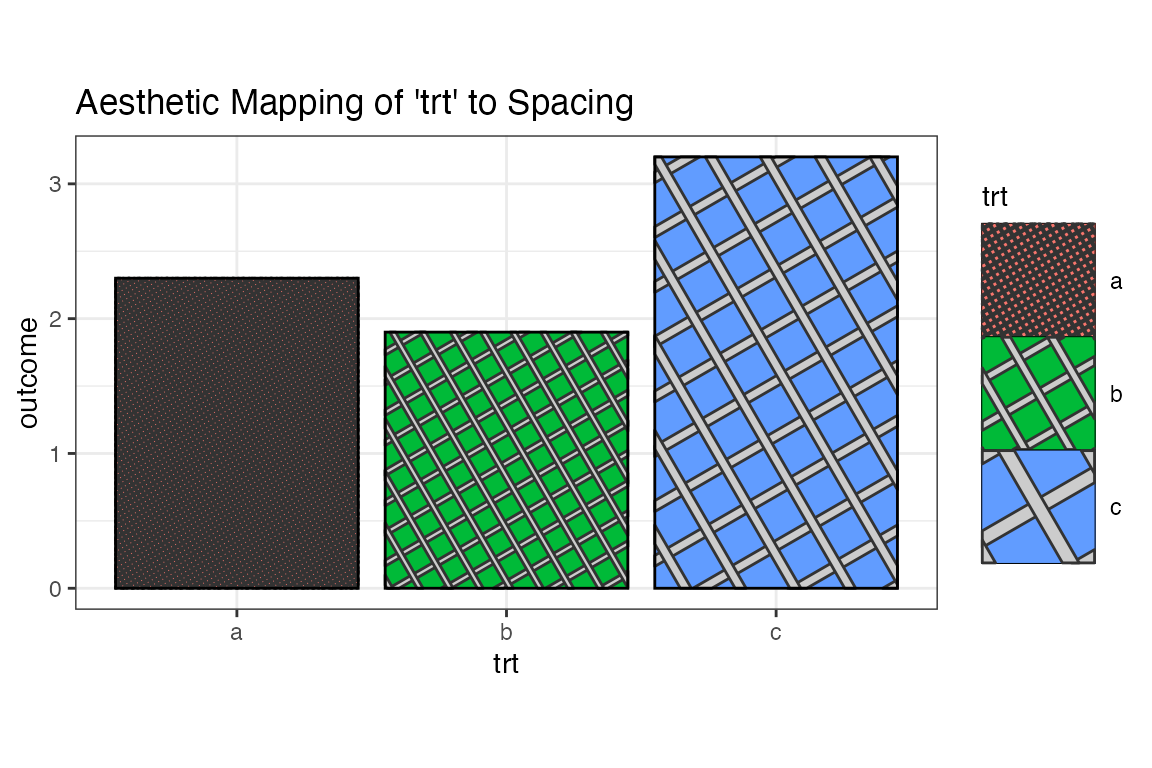
The Fill Aesthetic as a Mapped Aesthetic
ggplot(df, aes(trt, outcome)) +
  geom_col_pattern(
    aes(fill = trt, pattern_fill = trt),
    colour          = 'black',
    pattern         = 'crosshatch'
  ) +
  theme_bw() +
  labs(title = "Aesthetic Mapping of 'trt' to Pattern Fill") +
  coord_fixed(ratio = 1/2) +
  scale_pattern_fill_viridis_d() +
  theme(legend.key.size = unit(1.5, 'cm'))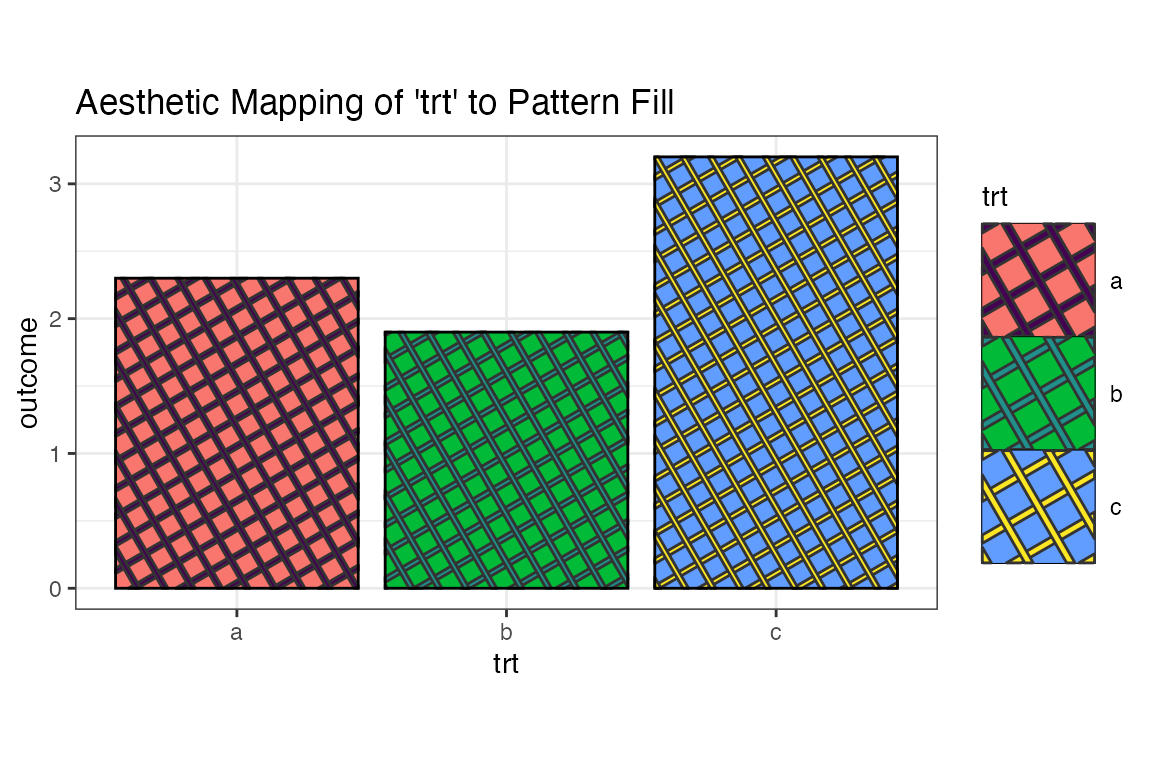
Technical Bits
- Crosshatches are implemented as two overlapping stripe patterns.
- The clipping of the crosshatch polygons is done by creating the crosshatches as sf objects, performing an
sf::st_intersection()with the element boundary, and then converting the clipped crosshatches back into agrid::polygonGrob(). - If lines had been used for the crosshatches, then there would be visual artefacts where the crosshatch intersects the boundary because the
lineendgraphic parameter can only besquare,roundetc, and cannot conform to the actual shape of the element boundary.